

The Share Market
Welcome back to our monthly market review. The S&P 500 performed better over the first-to-last trading-day comparison, edging up +0.26% from 7,631.47 to 7,651.54. The S&P/ASX 200 fell -3.06% from 9,066.70 to 8,789.30. Both indices were weaker on the conventional calendar-month basis, which compares 31 August with 30 September.
S&P ASX 200 performance
The Australian benchmark closed 1 September at 9,066.70, its highest close of the month (the 31 August close was slightly higher, at 9,076.00), and ended 30 September at 8,789.30. The -277.40-point first-to-last change was a -3.06% return. Its conventional calendar-month result was -3.16%, calculated against the 31 August close of 9,076.00. The closing trough was 8,665.00 on 25 September 2026; the high-to-low closing range was 401.70 points, or 4.64% of the low. The largest daily rise was +0.92% on 30 September 2026; the largest fall was -1.03% on 10 September 2026.
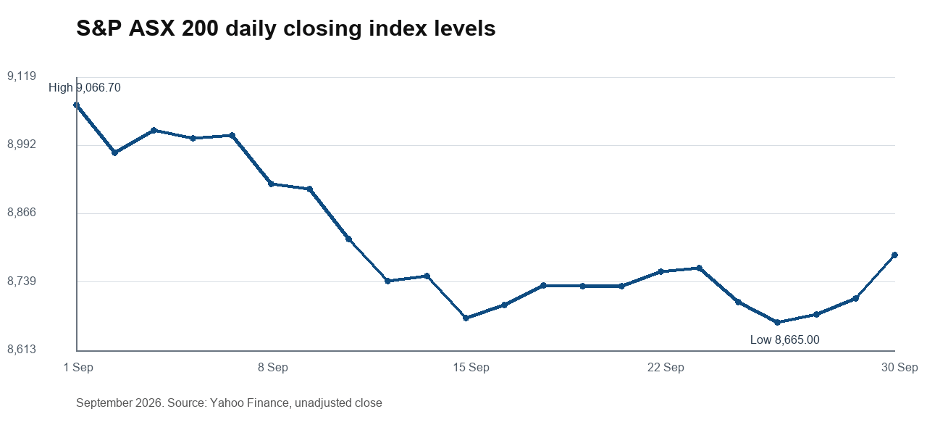
The price sequence shows a fast early-month descent, a partial mid-month recovery, and a late rebound. The index fell 4.35% from 1 September to a close of 8,672.50 on 15 September, held around 8,730 from 17 to 21 September, and reached 8,765.30 on 23 September before slipping to the 8,665.00 trough on 25 September. It then rose in each of the last three sessions, recovering 124.30 points, or about 31% of the month's closing range. It would be too strong to assign each daily move to one factor. The macro setting nevertheless became more restrictive: on 29 September the RBA lifted the cash-rate target by 25 basis points to 4.60 per cent, citing elevated inflation, much higher global energy prices, AI-related price pressure on technology goods and continuing domestic capacity pressure. That is relevant context for bank funding costs, mortgage-sensitive demand and the discount rates applied to long-duration equities, but it does not by itself prove a particular index move. RBA decision, 29 September 2026.
The timing is also important. The index had already fallen 4.43 per cent from its 1 September close to the 25 September trough. It rose 0.17 per cent on 28 September, before the Board's decision, and a further 0.34 per cent on 29 September, when the 2:30 pm AEST announcement fell within trading hours. The largest gain of the month, +0.92 per cent on 30 September, coincided with an August inflation print that was slightly lower than expected and with traders scaling back bets on a further rate rise in November. Capital Brief, 30 September; ABC News, 30 September. That sequence argues against treating the rate decision as the sole explanation for the month or for the rebound. A more measured reading is that the market was processing a cluster of rate, inflation, energy and global-growth risks. Higher cash rates normally raise the rate used to value future earnings, which can restrain price-to-earnings multiples. They may also temper household spending and housing credit. Conversely, a resources-heavy market can receive a different signal when commodity and global-demand assumptions change. Those cross-currents are consistent with a volatile month, but company results, positioning and exchange-rate changes could have mattered as well.
S&P 500 performance
The S&P 500 closed 1 September at 7,631.47, fell to a closing low of 7,551.81 on 16 September 2026, and then rallied to a closing high of 7,764.70 on 21 September 2026. It finished at 7,651.54, a +20.07-point or +0.26% first-to-last gain. The conventional calendar-month comparison is -0.45% from the 31 August close of 7,686.14. The closing range was 212.89 points, or 2.82% of the low; the largest daily rise was +1.49% on 21 September 2026, while the largest fall was -0.77% on 28 September 2026.
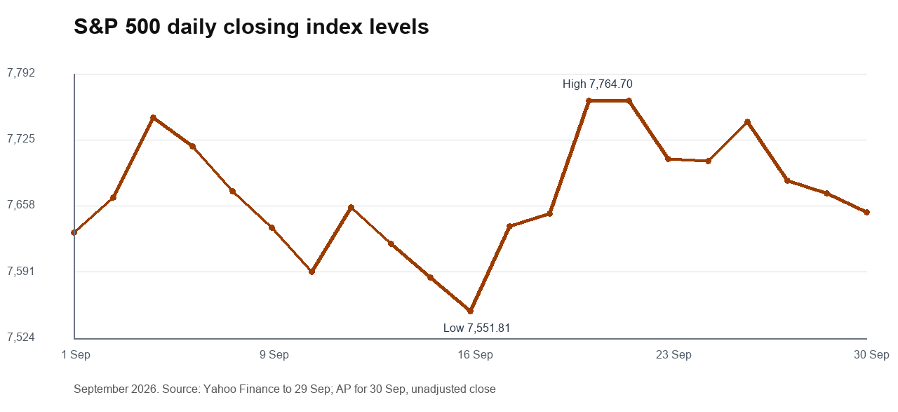
The 16 September trough occurred on the same date the FOMC raised its target range by 25 basis points to 3.75 to 4.00 per cent. The statement described solid activity, resilient spending and elevated inflation. Higher policy and bond yields tend to weigh more heavily on high-duration technology valuations because more of their expected cash flow sits further in the future, but contemporaneous price action cannot prove that the decision alone produced the move. Federal Reserve statement, 16 September 2026.
Late in the month, the index retreated as oil-price volatility and higher Treasury yields became the dominant reported market context. AP reported that the 10-year yield briefly topped 5.27 per cent on 28 September before easing to 5.23 per cent, its highest in roughly two decades, amid uncertainty about shipping through the Strait of Hormuz, and that technology companies were an important drag early in the month when higher oil and yields revived inflation concerns. On 30 September the S&P 500 fell 19.30 points to 7,651.54 after a morning inflation-related lift faded as stronger growth data kept yields high.
The S&P 500 path therefore had two distinct phases. The first half of September moved down as energy and rate concerns intensified, culminating in the 16 September closing low. The second phase saw a recovery through 21 September, when the benchmark reached 7,764.70, before the final-week pullback. That rebound shows why the first-to-last figure alone understates the intra-month risk experienced by an investor. The concentration of the S&P 500 in very large technology firms is relevant here: changes in Treasury yields can alter the present value assigned to expected future growth, while the same firms can still support the index when earnings expectations are resilient. The market reporting identifies yields, oil and individual technology shares as contemporaneous influences; it does not establish a single mechanical explanation for every turn.
Direct comparison of the markets
The difference is clearer in the path than in the endpoint. Australia's index fell 4.43% from its 1 September close to the 25 September trough, with only a partial mid-month recovery, whereas the S&P 500 recovered from its 16 September low and briefly set its month high on 21 September. On a calendar-month basis the gap is 2.71 percentage points (-0.45% against -3.16%); on a first-to-last basis it is 3.32 points (+0.26% against -3.06%). The US benchmark's first-to-last result is positive, yet its calendar-month return is negative, because it fell 0.71% on 1 September and so started the month below its 31 August close of 7,686.14. The ASX 200 fell only 0.10% on its first session, so its two measures nearly coincide. This distinction matters: the first-to-last measure describes the month's observed sequence, while the conventional measure captures the investor experience from one month-end to the next.
Sector mix offers a plausible explanatory lens, not a complete causal answer. The S&P 500 has a much greater weight in large technology companies, making it especially sensitive to changes in long-term discount rates and to AI-related earnings expectations. The ASX 200 has larger relative exposures to banks and resources. A higher Australian cash rate can support bank interest income in some circumstances while also raising funding, credit-quality and borrower-stress risks. Resources are more sensitive to global growth and commodity expectations. These channels help explain why the two indices need not move together, but index-level evidence is insufficient to allocate the September result precisely among them.
The relative resilience of the S&P 500 should not be mistaken for a lower-risk month. Its 2.82 per cent closing range was smaller than the ASX 200's 4.64 per cent range, but the index still moved from a mid-month low to a monthly high in only three sessions (17, 18 and 21 September). In Australia, the range reflected a 4.35% slide to 15 September, a partial recovery to 8,765.30 on 23 September, and a second leg down to the 25 September trough; the last three sessions then recovered about 31% of the range. The contrast suggests that US growth-stock exposure helped the benchmark rebound when sentiment improved, while Australia's financials and resource exposures left the local index more exposed to the month's restrictive-rate and global-demand themes. This is an interpretation of composition and price action, rather than evidence that one sector accounted for the full return.
Implications arising from the month’s price action
September reinforced that the direction of yields can matter as much as the level of an index. The late-month US decline came alongside oil volatility and high Treasury yields, while Australia closed the month after a fresh RBA increase. For equity investors, the immediate watchpoints are inflation and energy-price developments, central-bank communications, and whether bond yields remain elevated. A continuation would keep pressure on valuation-sensitive technology and rate-sensitive Australian sectors; a sustained easing in inflation or energy concerns would weaken that mechanism. This is a market-observation framework, not a forecast or a recommendation to buy or sell.
The Residential Property Market
Australia’s housing correction deepened in September. Cotality’s Home Value Index fell 1.1% nationally, the sixth consecutive monthly decline, and every capital city except Darwin recorded a fall. The month’s data point to a market shaped by weaker borrowing capacity, cautious buyers and slower sales absorption, rather than a simple increase in new stock.
National dwelling values fell 1.1% in September and 3.7% over the September quarter. The annual result was flat at 0.0%, a backwards-looking measure that still includes gains earlier in the cycle. At $899,236, the national median dwelling value was 5.2% below the March 2026 peak. The sixth consecutive monthly fall confirms that momentum has weakened rather than merely paused.
Cotality’s HVI is a hedonic index, designed to control for changes in the mix of properties sold. Its results are revised for the prior 12 months as more sales information arrives, so this report uses the current October release consistently rather than combining earlier snapshots.
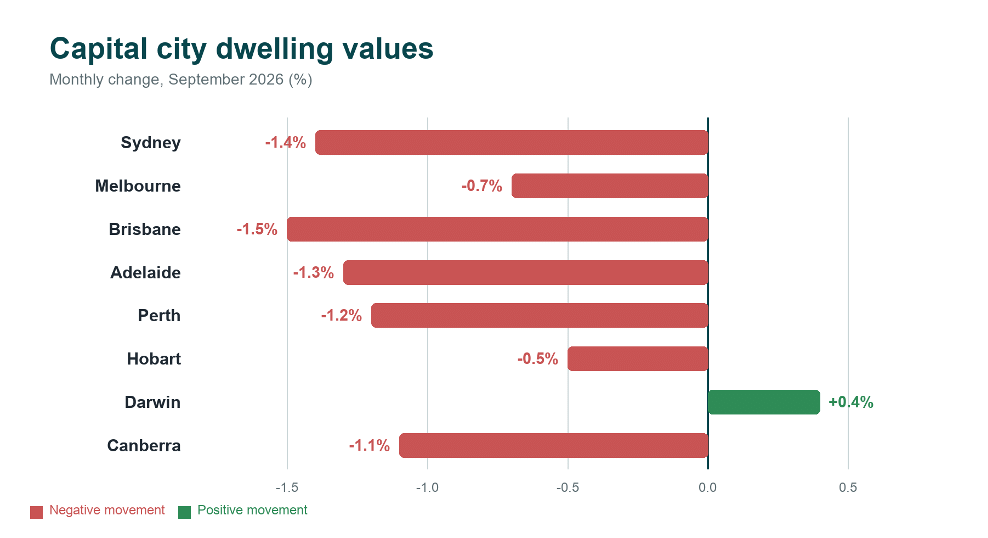
Combined capital-city values fell 1.2% in September, 4.3% over the quarter and 1.8% over the year. Their median value was $973,525. The correction was geographically broad: seven of the eight capitals declined, and Cotality estimates that 97% of capital-city suburbs fell over the three months to September.
Source: Cotality Home Value Index October 2026
Brisbane recorded the sharpest monthly fall, down 1.5%, followed by Sydney at -1.4%. Adelaide (-1.3%), Perth (-1.2%) and Canberra (-1.1%) also fell by more than 1%. Melbourne’s -0.7% decline was milder than the mid-sized capitals, while Hobart fell 0.5%. Darwin rose 0.4%, its only positive monthly capital-city result, and also retained the strongest annual gain at 11.9%.
Annual changes show how uneven the cycle remains. Perth (+10.1%), Darwin (+11.9%), Hobart (+7.0%), Adelaide (+6.5%) and Brisbane (+5.9%) were still above their values a year earlier, while Sydney (-7.0%), Melbourne (-6.2%) and Canberra (-1.6%) were lower. Sydney was 8.6% below its February peak and Melbourne was 7.2% below its November 2025 cyclical high.
Regional markets
Regional dwelling values were more resilient than capital cities but were not immune. The combined regional index fell 0.7% in September and 1.9% over the quarter, compared with falls of 1.2% and 4.3% across the combined capitals. Regions remained 5.6% higher over the year, with a median value of $758,931, but Cotality reported that 71% of regional SA3 sub-markets declined during September.
The comparison suggests regional markets are cushioning the national result rather than resisting the downturn outright. Their stronger annual performance reflects later-cycle gains and a less severe quarterly decline. With the majority of regional sub-markets now falling in September, the key question is whether this resilience can endure if credit conditions and buyer sentiment remain weak.
Demand, stock and buyer behaviour
Housing turnover has weakened sharply. Cotality estimates national home sales over the past three months were 19.1% lower than a year earlier and 13.3% below the previous five-year average. The annual sales decline was especially large in Brisbane (-27.2%), Sydney (-26.5%) and Perth (-24.2%). Falling transaction volumes indicate that buyers and sellers are taking longer to agree on price and timing.
Advertised supply has accumulated even as fewer new listings arrive. In the combined capitals, new listings were 9.2% lower than a year earlier, but total advertised inventory was 23.1% higher because the rate of sale fell faster. Capital-city homes took a median 39 days to sell, compared with 23 days a year earlier. This has improved buyer choice, although Cotality notes many prospective purchasers lack either confidence or financial capacity to act.
Interest rates and borrowing capacity
On 29 September, the Reserve Bank increased the cash-rate target by 25 basis points to 4.60%, its fourth increase of 2026. The Board said inflation remained too high and that the further tightening was warranted to support a return to target. The rate decision occurred at the end of the HVI measurement month, so it cannot explain September’s index outcome; however, it is relevant to the forward outlook for serviceability, demand and confidence.
Cotality estimates the four rate rises since February have reduced borrowing capacity for a median-income household by almost $90,000, or around 9% of purchasing power. That estimate helps explain why prices, turnover and buyer confidence have weakened together, but it does not establish a uniform effect across cities. Affordability, existing supply and the size of earlier gains remain important local differences.
Cotality reports a sixth straight monthly fall in national values, weaker turnover, rising available stock and falls spreading across capital-city and regional markets, with Brisbane and Sydney weakest in September and Darwin and the regional aggregate comparatively firm. Buyers have more choice, but borrowing costs, less favourable investor tax settings and weak sentiment limit their capacity to act. If rates stay high or rise further, soft conditions are likely to persist; stabilising rate expectations, sales volumes and selling times would signal a firmer base. These are interpretations, not forecasts, and views on the scale of any further decline differ: Cotality's most likely outcome is a gradual drift lower rather than a material downturn, while experts quoted by the ABC warn of peak-to-trough falls of up to 15% nationally.
Inflation and Interest Rates
Another Upward Shift in Interest Rates
On 29 September 2026, the Reserve Bank of Australia announced a unanimous decision to increase the official cash rate target by 25 basis points, bringing it to 4.60 per cent. This marks the fourth time the central bank has raised the rate in 2026, taking the total increase to 100 basis points this year, according to the Commonwealth Bank.
For mortgage holders, this development means higher monthly repayments as lenders pass on the increase. On the flip side, Australians with savings accounts might finally see some relief, as financial institutions often increase the interest paid on deposit accounts following a cash rate rise. The Board's statement focused on ensuring high inflation does not become embedded, noting that tighter financial conditions are warranted. Looking ahead to their next meeting on 3 November, the Board stated they will continue to do what is necessary to bring inflation back to target, including increasing the cash rate further if needed.
Inflation: Prices Continue to Rise
To understand the central bank's reasoning, we only need to look at the latest inflation figures. The Australian Bureau of Statistics released the complete monthly Consumer Price Index (CPI) on 30 September 2026, revealing that annual CPI rose to 4.0 per cent in August, up from 3.5 per cent in July.
What is driving this increase? The ABS highlights that housing and transport costs are the primary factors:
- Annual Housing inflation was 5.7 per cent, reflecting rising costs for both new dwellings and electricity.
- Annual Transport inflation was 5.6 per cent.
- Fuel prices rose 14.8 per cent in August, driven by higher world oil prices and the unwinding of the remaining federal fuel excise relief.
It is also helpful to look at trimmed mean inflation, a metric published by the ABS. The annual trimmed mean stayed at 3.6 per cent for the third consecutive month in August. The ABS noted that automotive fuel and electricity were both excluded from the trimmed mean in August, which drove the gap between the headline and trimmed mean figures. While the trimmed mean suggests some underlying stability, headline inflation remains stubbornly above the central bank's target band of 2 to 3 per cent.
What This Means for You
The combination of a 4.60 per cent cash rate and a 4.0 per cent headline inflation rate paints a clear picture: the effort to stabilise the Australian economy is ongoing. The Reserve Bank is using the tools at its disposal to cool down rising prices, but everyday costs remain high.
As we move further into spring, it is a sensible time to review your financial situation. Whether it involves comparing savings account rates to make the most of the higher cash rate, or speaking with your bank about your home loan, staying informed is your best strategy. We will continue to monitor these developments and provide updates based on official data to help you manage your household finances effectively.