

The Share Market
Welcome back to our monthly market review. The S&P 500 performed better over the first-to-last trading-day measure, rising 1.13%, compared with 0.63% for the S&P/ASX 200. Measured conventionally from the prior month-end close, the S&P 500 gained 2.62% and the S&P/ASX 200 gained 1.11%. Both markets began with an energetic risk-on rally, but August finished with renewed sensitivity to inflation, bond yields and the Middle East conflict.
ASX 200
The Australian market added 56.70 points between its first and final August closes, but the more conventional month-end comparison was stronger because the index rose 42.50 points on 3 August from 31 July. The largest daily increase, 1.40% on 4 August, extended a broad rally that lifted the index to a five-month high. ABC reported that the move followed Wall Street’s record run and was supported locally by technology, healthcare and financials; it is fair to read that as a synchronised risk-on session, rather than as a single-cause move.
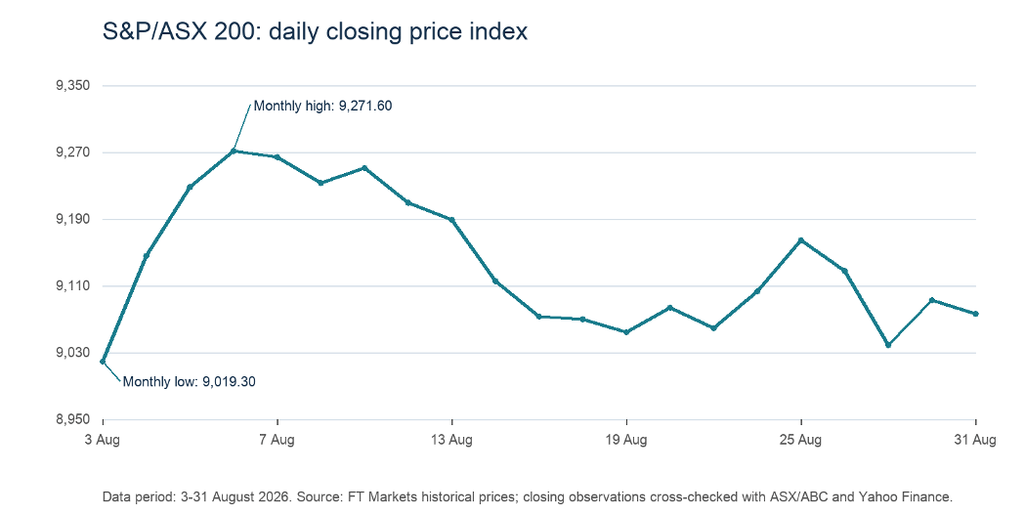
Momentum carried the index to a record closing high of 9,271.60 close on 6 August. Higher gold and copper prices and a strong set of company results were reported as drivers, with AMP’s reported profit increase and buyback among the day’s company-specific supports. This mattered because materials are unusually important in the Australian benchmark; its gains were not simply a technology echo from the United States.
The middle of the month was less forgiving. The Reserve Bank of Australia held the cash rate target at 4.35% on 11 August and retained a clear warning that it could raise rates again if upside inflation risks materialised. The decision did not itself force a one-way move in the index, but it left bank lending, household demand and rate-sensitive valuation assumptions exposed to incoming data.
That sensitivity showed in financials. Westpac’s 10 August update dragged the sector, while Commonwealth Bank’s 12 August result initially impressed before concerns about softer forward indicators, mortgage applications, impairments and arrears took hold. The index closed 0.45% lower on 12 August. These were company and sector developments, so they should not be presented as a complete explanation for every subsequent point change.
The closing low after the peak came on 27 August, when the index fell 0.98% to 9,038.20. The ABS had released July CPI the day before: annual headline inflation slowed to 3.5%, but trimmed-mean inflation held at 3.6% and the monthly increase was 1.0%. Reuters reported that the result lifted rate-hike concerns and that miners and consumer staples were weak. The timing makes the inflation release relevant context, while the price move also reflected sector and earnings-season influences.
S&P 500
The S&P 500 rose 85.64 points from the first August close to 7,686.14 on 31 August. Its conventional month-end gain was 2.62%, more than twice the Australian result. The month’s decisive early move was 4 August, when the index rose 1.79%, its largest daily advance. Reuters linked the record-setting rally to upbeat AI-related forecasts from Caterpillar and Palantir, alongside hopes for a Middle East agreement. The reported connection is stronger than simple date coincidence, although the index was also responding to a broad earnings and policy backdrop.
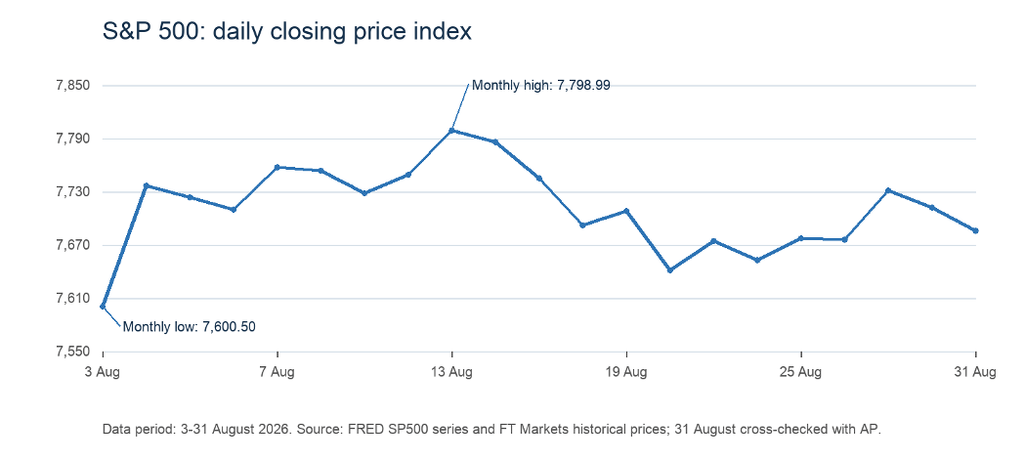
Labour and inflation data then supported the rate narrative. The BLS reported a 23,000 fall in July payrolls on 7 August, and AP said the weakness increased hopes that the Federal Reserve could wait longer before further rate increases. July CPI rose only 0.1% month on month on 12 August; the following day final-demand PPI was unchanged in the month. On 13 August the S&P 500 reached its monthly high of 7,798.99, with AP and Reuters connecting the gain to a softer-than-expected producer-price result and gains in heavyweight technology shares.
The record did not hold. On 18 August, AP reported that Nvidia, Micron and Broadcom were among the heaviest weights as AI valuations came under criticism; the index fell 0.69%. Two sessions later it recorded its largest decline, down 0.87% to 7,641.16. Reuters attributed that session to rising Treasury yields, a rare Walmart sales miss and higher oil prices that revived inflation concerns. These moves illustrate the S&P 500’s dual exposure: its high-value technology leaders can drive the index higher on earnings optimism, but their sensitivity to rates and crowded AI expectations can also magnify reversals.
The late-month rebound was equally concentrated. On 27 August the S&P 500 gained 0.72%, led by Nvidia after better-than-expected profit and revenue-growth guidance, while Salesforce also reported stronger profits. The final 31 August close reversed 0.33% after US strikes on Iranian rocket launchers near the Strait of Hormuz pushed oil higher and the 10-year Treasury yield rose, according to AP.
Direct comparison of the markets
The headline contrast is clear: the S&P 500 retained a 2.62% calendar-month gain despite a 2.02% peak-to-subsequent-trough drawdown, while the S&P/ASX 200 gained 1.11% after a deeper 2.52% drawdown from its 6 August closing record. In both cases the early rally was interrupted by the same broad themes: the expected path for interest rates, higher oil prices and the uncertain path of the Iran conflict. Yet their market structures changed the transmission of those themes.
The S&P 500's 38.03% information-technology weight in the SPY portfolio (as at 27 August) helped the benchmark respond immediately to AI-linked earnings and guidance, particularly on 4, 13 and 27 August, but also left it vulnerable when investors reassessed AI valuations and when higher bond yields raised the discount rate applied to long-duration earnings. Australia's benchmark looked different: BlackRock's IOZ portfolio, which tracks the S&P/ASX 200, showed financials at 34.05% and materials at 25.51% on 6 August, so the early advance depended more on banks, miners, gold and copper than on a narrow set of global technology leaders. That composition supplied a different form of cyclicality, commodity prices and earnings helped the record run, but a more restrictive domestic rate outlook exposed banks and consumer sectors, while materials weakness weighed heavily on 27 August.
The comparison should not be reduced to technology versus resources; both indexes contained rate-sensitive sectors and both were affected by geopolitical oil risk. Still, the US benchmark recovered late in the month through a specific technology earnings catalyst, while the Australian index rebounded on 28 August but did not regain its earlier high, leaving its month-end result more dependent on whether banks, materials and the domestic inflation path can stabilise together.
Implications arising from the month's price action
August left a constructive but less comfortable backdrop than the month-end returns alone suggest. The S&P 500's gain was led by record highs and strong AI-related reporting, yet its largest decline came when yields, oil and a consumer earnings disappointment moved together; the relevant watchpoint is not merely the next technology result but whether inflation and funding conditions allow earnings growth to translate into durable valuation support. For Australia, the post-peak decline coincided with evidence that underlying inflation remained elevated and with visible fragility in bank narratives, and the RBA's 11 August statement kept further tightening on the table. Without portfolio weights, the appropriate posture is watchlist rather than a prescribed trade: monitor the next CPI release, RBA communication, bank margin and arrears commentary, and iron ore, gold and oil price developments.
The strongest counterargument is that August's late weakness was a short-lived consolidation after broad gains, not a change in the earnings cycle, a view supported if inflation moderation resumes, yields settle and the major banks and miners continue to meet expectations, and weakened if oil-driven price pressure persists, policy expectations tighten further, or early-month enthusiasm fails to broaden into earnings support. This is an inference from the documented price action, not a claim of certainty.
The Residential Property Market
Australia's housing downturn broadened further in August, with the national monthly decline accelerating and weakness spreading across more markets. Cotality's national Home Value Index fell for a fifth consecutive month, while the share of capital-city suburbs recording a decline through winter more than doubled from autumn. Regional markets remained relatively more resilient, but they also moved further into decline. The defining feature of the month was not simply weaker prices, but the spread of weakness across cities, regions and value tiers.
National market
The national index fell 0.9% in August, its largest fall in the current five-month sequence. Values declined 3.1% over the three months to August, yet remained 2.7% higher than a year earlier. The national median dwelling value was $912,885. Cotality estimates that values were 3.6% below the March 2026 peak at month end, confirming that the market had moved beyond a brief loss of momentum into a broad correction.
The annual figure remains positive because it still captures strong gains from late 2025 and early 2026. It should not be read as evidence that current conditions are rising. The monthly and quarterly measures show the present direction more clearly. Cotality also notes that its hedonic indices are revised monthly for the preceding 12 months, which matters when comparing the latest release with figures reported earlier in the year.
Capital cities
Combined capital-city values fell 1.1% in August and 3.7% over the quarter. Their annual gain narrowed to 1.1%, well below the 7.7% recorded across the combined regions. The combined-capital median was $990,394. Seven capitals declined during August; Darwin was the sole exception.
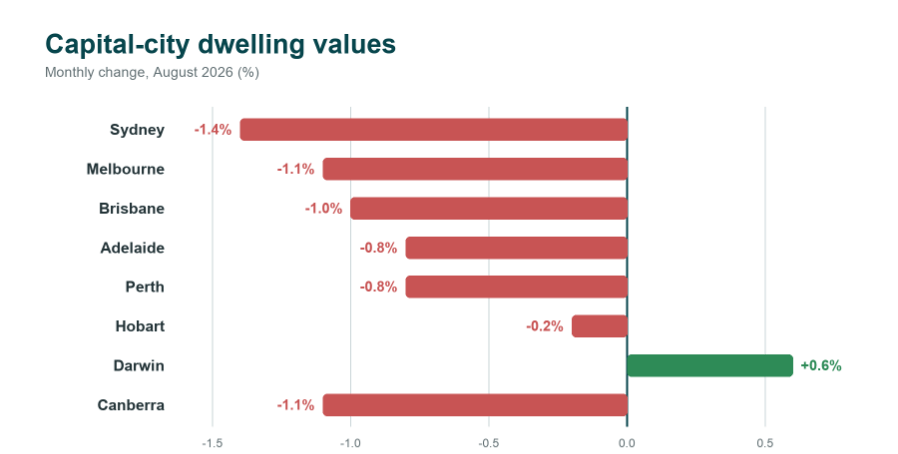
Sydney led the decline at 1.4% for the month and 4.7% over the quarter. Its median value was $1,222,718, and values were 7.1% below their February peak. Cotality links Sydney's relative weakness to sharply lower demand and above-average advertised stock. Melbourne and Canberra each fell 1.1% in August. Melbourne's annual result was the weakest of the capitals at -4.7%, while Canberra was down 0.4% over the year.
Brisbane fell 1.0% in August, followed by Adelaide and Perth at -0.8% each. Their annual positions remained much stronger than those of Sydney, Melbourne and Canberra: Brisbane was up 10.8%, Adelaide 8.6% and Perth 15.6% over the year. This contrast shows how quickly current momentum has turned even in markets with sizeable earlier gains. Hobart recorded the smallest monthly decline at 0.2%. Darwin rose 0.6% and was the only capital with positive quarterly growth, at 0.9%.
Regional markets
The combined regional index declined 0.4% in August, less than half the 1.1% fall across the combined capitals. Regional values were down 1.2% over the quarter, but still 7.7% higher over the year, with a median dwelling value of $764,020. Regional South Australia was the only broad rest-of-state market to avoid a decline through the three months to August.
Regional resilience is relative rather than absolute. A Cotality regional update published in August, covering the three months to July, had already shown slower growth in 47 of the 50 largest regional urban areas and outright declines in 22. It identified regional New South Wales and Victoria as the weakest broad markets, while more affordable centres in Western Australia and South Australia were comparatively firmer. The August HVI indicates that the slowdown subsequently widened, even though regional markets continued to outperform the capitals.
A broader downturn across price tiers
Earlier in the correction, higher-value housing generally weakened faster as large loan sizes magnified the effect of elevated mortgage rates and serviceability limits. That gap narrowed in August. Premium markets still tended to record larger falls, but lower-priced properties were no longer insulated. Cotality reported that 93% of capital-city suburbs recorded a value decline through winter, compared with 45.8% through autumn. The widening suggests affordability pressure and softer demand are now affecting a much larger part of the market rather than remaining concentrated in expensive suburbs.
Demand, listings and selling conditions
The supply-demand balance has shifted towards buyers, although buyer participation itself remains subdued. Cotality's quarterly estimate of home sales was 15.5% below a year earlier and 11.5% below the five-year average. Estimated sales in Brisbane, Perth and Sydney were more than 20% lower than a year earlier.
At the same time, advertised stock accumulated because homes were being absorbed more slowly. Across the capitals, total listings over the four weeks to 30 August were 24% higher than a year earlier and 8% above the five-year average. New listings were actually 6% lower than a year earlier and 8% below average. Longer selling times, larger vendor discounts and low auction clearance rates were consistent with weak demand, not a surge of vendors entering the market.
Interest rates and borrowing capacity
The Reserve Bank left the cash rate target at 4.35% on 11 August after three increases totalling 75 basis points in 2026. The Board judged monetary policy to be somewhat restrictive and noted that higher rates had passed through to housing lending rates. This backdrop is consistent with Cotality's observations about reduced borrowing capacity, price sensitivity and weaker transaction activity. It does not, by itself, prove that rates caused each month's price movement, because local supply, prior growth and affordability differ materially between markets.
Inflation and Interest Rates
The RBA left the cash rate unchanged at 4.35% on 11 August, unanimously, following three 25bp hikes earlier in 2026 (75bp cumulative). The Board called policy "somewhat restrictive" but kept an explicit bias to hike again if upside inflation risks materialise. Its central forecast has trimmed mean inflation at 3.3% and headline at 3.6% by December 2026, with both returning to the 2.5% midpoint only in early 2028 — forecasts, not outcomes.
RBA minutes (released 25 August) show the Board considered both a hike and a hold, judging there was time to assess incoming evidence. Scheduled mortgage payments are near their 2024 peak as a share of household income. This is a sign earlier tightening is still flowing through.
The ABS's July CPI (released 26 August) was mixed:
- Headline: 3.5% y/y, down from 3.8% in June; +1.0% in July (original), +0.6% (seasonally adjusted)
- Trimmed mean: 3.6% y/y, unchanged — firmer than economists expected
- Housing (+5.0% y/y): new dwellings +5.7%, rents +3.6%, electricity +6.1% y/y (but −1.6% in the month, after annual price reviews)
- Fuel: +7.5% in July after three monthly falls, linked to higher oil prices and the fuel-excise rollback
- Meals out/takeaway: +4.5% y/y on higher input costs
- Domestic holiday travel: +6.2% in the month, on school holidays
Separately, the July labour force release (20 August) showed unemployment rising to 4.5% (from 4.4%), with employment down 15,800 — consistent with the RBA's expected gradual labour-market easing, and a modest offset to hike pressure.
Market pricing cited in the RBA's August Statement (as at 5 August) implied roughly a 50% chance of another hike by year-end. The firmer July CPI has since strengthened the case for a later move, and three of the four major banks now expect a hike: NAB calls a rise in September; CommBank (as of 27 August) and ANZ both call a rise to 4.60% in November. Westpac (28 August) is the holdout, seeing raised risk of a November hike but keeping a hold as its base case, noting one monthly print isn't enough to act on. These are bank forecasts, not RBA guidance — the next full quarterly read isn't out until late October.
Our read: the case for a September move is weaker than the case for keeping an explicit tightening bias open. A later hike looks more plausible than a September one, given the softening jobs data and the lag on 75bp of prior tightening, but a cut looks hard to justify until trimmed mean inflation is clearly and durably easing. What this could mean for households:
- Variable-rate borrowers: current repayments hold; another rise is a real, if uncertain, risk.
- Fixed-rate borrowers approaching expiry: review refinancing and repayment buffers now — planning steps, not a prediction.
- Savers: deposit rates likely stay relatively elevated while policy remains restrictive.
- All households: cost pressure is uneven — rents, new dwellings, food and some services are still rising steadily, while fuel and travel are more volatile month to month.