

The Share Market
Welcome back to our monthly market review. If you have been keeping a close eye on your household budget recently, you are likely all too familiar with the ongoing conversation around the cost of living. This everyday reality is the very same puzzle that central banks and financial markets spent July trying to solve. As we review the performance of the S&P/ASX 200 and the S&P 500, we see a clear demonstration of how central bank policy, and the mere anticipation of it, can dictate the direction of major indices. Let's look closer at what drove the numbers this past month. Please be assured that all research incorporated into this analysis is derived exclusively from reliable, reputable sources.
ASX 200
The Australian market experienced a robust performance throughout July. As illustrated in the chart below (thanks for Google Finance), the S&P/ASX 200 opened the month near 8,720 points and experienced a steady, if occasionally uneven, climb. The index found solid footing in the final week, surging past 9,000 points before ultimately closing the month at 8,978.
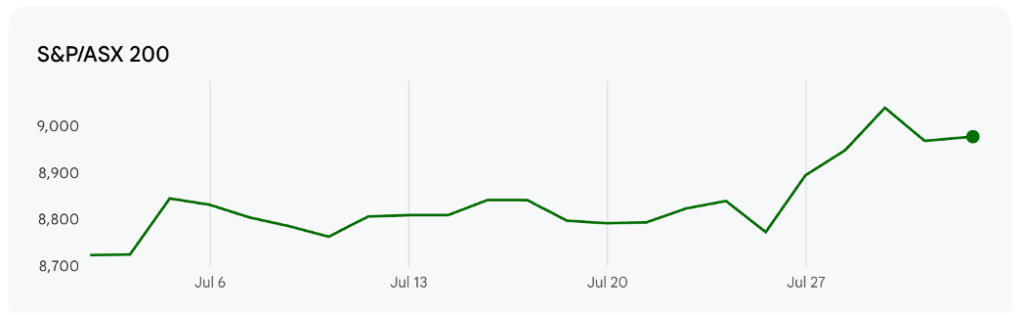
This impressive upward momentum was heavily influenced by domestic economic data and expectations surrounding the Reserve Bank of Australia. The market found comfort in the latest Consumer Price Index data released by the Australian Bureau of Statistics, which showed that the annual inflation rate unexpectedly eased to 3.8 per cent in June, down from 4.0 per cent in May. This cooling of inflation, particularly a moderation in goods inflation and transport costs due to falling fuel prices, provided a welcome relief for investors.
This softer inflation data significantly influenced market expectations regarding the RBA's upcoming monetary policy meeting on 11 August. Following the CPI release, major financial institutions, including Commonwealth Bank, NAB, and ANZ, solidified their forecasts that the RBA will leave the official cash rate unchanged at 4.35 per cent.
The prospect of a continued pause in rate hikes provided a tailwind for Australian equities. The SPDR S&P/ASX 200 ETF (STW), which tracks the performance of the index, reflected this optimism, closing the month with a strong daily gain of nearly 3 per cent. The index's composition, heavily weighted towards major financial institutions like Commonwealth Bank and resource giants like BHP, allowed the market to capitalise on the perception that the worst of the tightening cycle may be in the rearview mirror.
S&P 500
In contrast to the Australian experience, the US market faced a more challenging environment. The chart below shows the S&P 500 opening July near 7,480 points. Despite early attempts to rally, peaking above 7,570 around mid-month, the index experienced significant volatility and a sharp decline in the final week, dipping below 7,320 before a late recovery to close near 7,490.
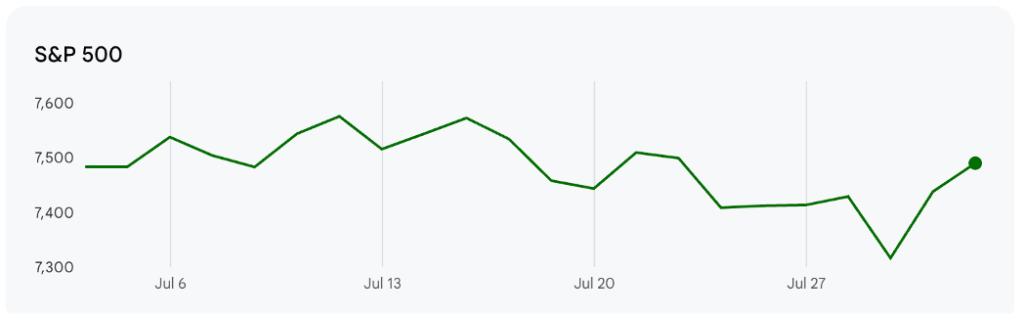
The primary catalyst for this turbulence was the ongoing uncertainty surrounding the Federal Reserve's approach to interest rates. The Federal Open Market Committee concluded its two-day policy meeting on 29 July with a decision to maintain the target range for the federal funds rate at 3.5 to 3.75 per cent. However, the underlying dynamics of this decision painted a complex picture.
The Fed noted that while economic activity is expanding, inflation remains elevated, driven in part by supply shocks in certain sectors, including energy. This persistent inflationary pressure meant the central bank could not signal an imminent easing of borrowing costs. The decision to hold rates was not unanimous; three committee members voted against the action, preferring an immediate rate hike of 0.25 percentage points. This dissent underscores the ongoing debate within the Fed about how aggressively to tackle inflation, which has remained stubbornly above the 2 per cent target.
For investors, the Fed's stance confirmed that interest rates will likely remain "higher for longer," a reality that weighed heavily on market sentiment, particularly for interest-rate-sensitive sectors.
The differing trajectories of the S&P/ASX 200 and the S&P 500 in July 2026 offer a compelling lesson in how local data and central bank posturing shape investment outcomes.
In Australia, signs of cooling inflation provided the market with the confidence it needed to push higher, banking on the RBA maintaining its current holding pattern. This allowed the domestic market to focus on underlying corporate strength and the prospect of a more stable borrowing environment for businesses and households.
Conversely, the US market remains caught in a tug-of-war between solid economic growth and sticky inflation. The Federal Reserve's clear signal that it will not rush to cut rates—and the internal division over whether more hikes are necessary—created an environment of uncertainty that ultimately capped the S&P 500's potential for the month.
As we move forward, these contrasting experiences highlight the importance of understanding the specific economic forces driving individual markets. While global trends exist, local inflation prints and central bank decisions will continue to be the primary conductors of market performance.
The Residential Property Market
For many Australians keeping a close eye on the property market, the latest figures make for sobering reading. The subtle cooling observed earlier in the year has developed into a more pronounced downturn, extending its reach beyond the major eastern capitals. The latest comprehensive market data confirms that this shift is part of an accelerating, nationwide trend. The primary findings are sourced directly from the latest Cotality Home Value Index report for August 2026, alongside consumer sentiment figures and market performance indicators.
The National Overview
The national property market experienced a sharp loss of momentum in July. According to Cotality, the national Home Value Index dropped by 0.7%, marking the steepest single-month decline the Australian housing sector has recorded since December 2022. The national median dwelling value now sits at $928,421.
The data highlights a swiftly changing environment. The national index is now 1.9% lower over the quarter, bringing the annual growth rate down to 5.3%. Crucially, the downturn is no longer confined to the largest cities, with previously resilient mid-sized capitals now being pulled into negative territory.
Capital City Trends
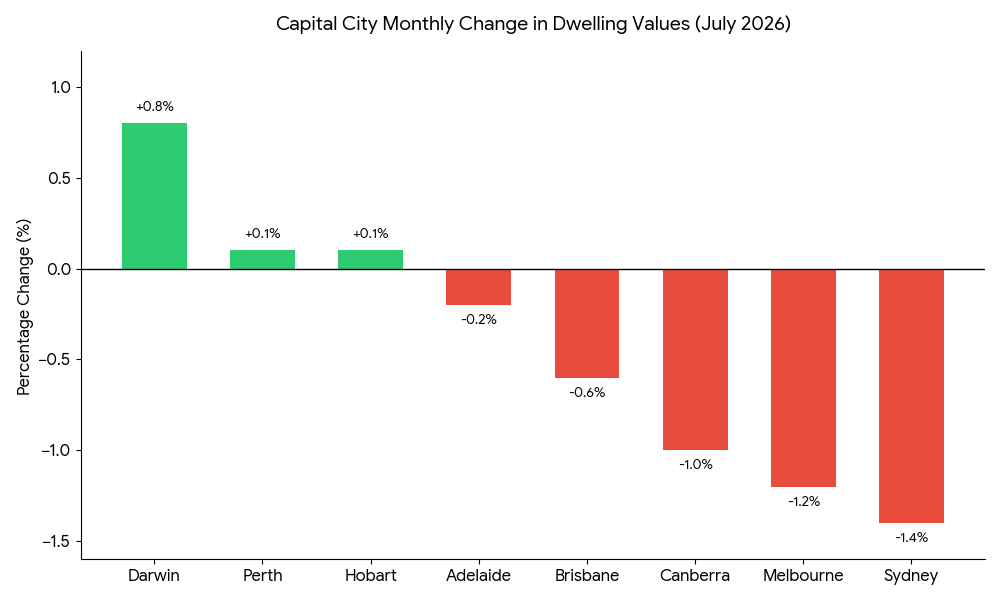
Sourec: Cotality HVI August 2026
The downward movement in national home values was driven by significant corrections across most major capital cities. Across the combined capital cities, values dropped by 0.9% in July, resulting in a 2.5% loss over the quarter.
- Sydney: The nation's most expensive capital city continues to lead the national decline. Sydney dwelling values fell by 1.4% over July, contributing to a substantial 4.0% drop for the quarter. The median dwelling value in Sydney is now $1,244,617, and values sit 5.3% below their recent peak in January 2026.
- Melbourne: Melbourne followed a similar trajectory, with dwelling values declining by 1.2% over the month and 3.4% for the quarter. This ongoing softness means Melbourne's annual growth rate is now -2.8%, with the city's median value at $797,354.
- Canberra: The nation's capital also experienced softer conditions, with values falling 1.0% in July and 2.1% over the quarter.
While the major eastern seaboard capitals led the decline, the mid-sized capitals, which had previously demonstrated remarkable resilience, also recorded falls:
- Brisbane and Adelaide: Home values in Brisbane and Adelaide fell by 0.6% and 0.2% respectively. According to Cotality, historical revisions indicate this is the second consecutive month of declines for both cities.
- Perth: Perth managed a minimal 0.1% increase in July. However, Cotality notes this follows a revised 0.5% contraction in June, pulling the formerly booming city into negative territory for that month.
- Darwin and Hobart: Darwin recorded a 0.8% monthly increase, while Hobart values rose by a marginal 0.1%.
Regional Markets Turn Negative
Outside the metropolitan capital cities, the demand-driven loss of momentum has now impacted regional property markets. The combined regional index fell by 0.2% in July, representing the first decline in this measure since January 2023.
Regional New South Wales saw the weakest outcome, with home values dipping 0.4%, followed by regional Victoria and regional Queensland, which both fell by 0.3%. Conversely, regional South Australia and regional Western Australia maintained some strength, with values rising by 1.4% and 0.9% respectively.
A Tiered Downturn
The decline in home values remains heavily weighted towards more expensive properties. Cotality reports that upper-quartile home values fell by 3.2% nationally over the three months to July, compared with a 0.3% gain across the lower price tier. This indicates that borrowing capacity and affordability constraints are significantly impacting the higher end of the market.
Behind the Slowdown
According to analysts, the rapid deceleration of the Australian housing market stems from a combination of economic barriers that have accumulated over recent months.
Affordability and Economic Pressures
Housing demand has been restricted by the cumulative impacts of affordability and serviceability pressures, alongside three interest rate hikes this year. These factors have raised mortgage repayments, reduced borrowing capacity, and exacerbated cost-of-living pressures. Higher fuel costs are also adding strain to household budgets.
Deepening Consumer Pessimism
Consumer sentiment remains deeply pessimistic, further dampening housing activity. While the Westpac-Melbourne Institute Consumer Sentiment Index increased by 4.1% to 83.9 in July, this follows near multi-decade lows in June and keeps confidence firmly in pessimistic territory. The survey indicates that households remain highly sensitive to interest rates, fuel prices, and broader economic uncertainty.
Supply and Demand Mismatch
The shifting balance of power between buyers and sellers is evident in recent market data. Cotality notes a deterioration in the flow of new listings, suggesting potential vendors are assessing the weak market and choosing to wait. However, total listings numbers have continued to track higher, sitting 5.7% above the five-year average across the combined capitals. This points to a mismatch between buyer and seller expectations, with properties taking longer to sell. Capital city auction clearance rates have remained below 50% since late May, though they have seen a slight uptick from mid-to-late June.
The Rental Market and Gross Yields
In contrast to falling property values, the residential rental sector remains tight. Cotality's national rental index rose by 0.4% in July. Annual rental growth has remained elevated, increasing by 5.9% year-on-year for the third consecutive month, adding approximately $40 per week to the median rent.
This growth is driven by extremely low rental vacancy rates, which moved marginally higher to 1.7% in July, still well below the ten-year average. As rents rise against declining home values, gross rental yields have moved higher. Across the combined capitals, the gross rental yield reached 3.56% in July, its highest rate since August 2019. However, these increases remain modest compared to the higher cost of borrowing.
Market Outlook
The Australian residential property sector presents a challenging picture. While a further deterioration in home values is expected, experts suggest several factors may reduce the risk of a sharp correction. Low unemployment supports housing demand and reduces forced sales, while ongoing population growth provides fundamental underpinning. Additionally, constraints on new housing construction and a potential pullback in new listings from vendors could limit downward pressure on values.
Inflation and Interest Rates
The RBA's Monetary Policy Board met in June 2026 and made the unanimous decision to hold the official cash rate target steady at 4.35%. This hold came after a series of three consecutive rate hikes earlier in the year.
The central bank's statement made it clear that this pause was a strategic decision to assess the impact of those previous hikes, which have tightened financial conditions and shown signs of slowing the economy as intended. However, the RBA was also quick to temper any immediate hopes of rate cuts. Governor Michele Bullock reiterated that inflation, at that point, remained uncomfortably high, driven by capacity pressures and the flow-on effects of higher global oil prices linked to the Middle East conflict.
The most anticipated economic news of July was the release of the Consumer Price Index (CPI) data for the June 2026 quarter by the Australian Bureau of Statistics (ABS). The figures, released on 29 July, offered a much-needed positive signal.
- Headline Inflation Eases: The annual headline inflation rate slowed to 3.8% in the 12 months to June 2026, down from 4.0% in May. During the month of June itself, the CPI actually fell by 0.1%.
- Underlying Inflation Holds Steady: Trimmed mean inflation, which is the RBA’s preferred measure as it strips out volatile price movements, held steady at 3.6%. This was a significant result, as it defied expectations that it might rise further and remained below the RBA’s own forecast of 3.8%.
While the overall inflation rate eased, certain sectors continued to put pressure on household budgets. The ABS highlighted that the most significant contributors to annual inflation in June were:
- Housing (+6.8%): This substantial increase was heavily influenced by electricity prices, which surged 22.4% annually, largely due to the ending of government rebates. New dwelling costs also rose 5.8%.
- Food and non-alcoholic beverages (+3.3%).
- Recreation and culture (+3.3%).
The softer-than-expected inflation data in July has significantly altered the outlook for the RBA's next monetary policy meeting scheduled for 11 August 2026.
Prior to the CPI release, there was genuine debate about whether the RBA would hike rates again, with some major bank economists, like Westpac, predicting further increases. However, the latest figures have largely diminished the case for an August rate hike. The steady trimmed mean inflation rate suggests that the RBA's current restrictive policy is working.
Market pricing and economic forecasts now heavily favour the RBA maintaining the cash rate at 4.35% for the foreseeable future, potentially into 2027. While an immediate rate cut seems unlikely given that inflation is still above the 2-3% target, the prospect of further increases has certainly receded.
For borrowers, this period of stability offers a chance to review their financial positions without the immediate threat of escalating loan repayments.