
The Share Market
If you have been checking your grocery receipts or paying for fuel lately, you have likely noticed that the cost of living remains stubbornly high. This everyday reality for households is closely mirrored in the financial markets, where inflation continues to dictate the terms for central banks globally. This month, we examine how the S&P/ASX 200 and the S&P 500 responded to these ongoing economic pressures, with a specific focus on the central bank meetings that defined the period.
The S&P/ASX 200: A Resilient Finish Amidst a Rate Hold
Looking closely at the Australian market, the graph below from Google Finance paints a picture of a volatile but ultimately positive month. The index started the period softly, dropping to a low near 8,600 points around June 10. However, it experienced a strong rally through the middle of the month, peaking near 8,960 points before settling to close at 8,778.70. This final position represented a gain of 0.56 per cent over the month.
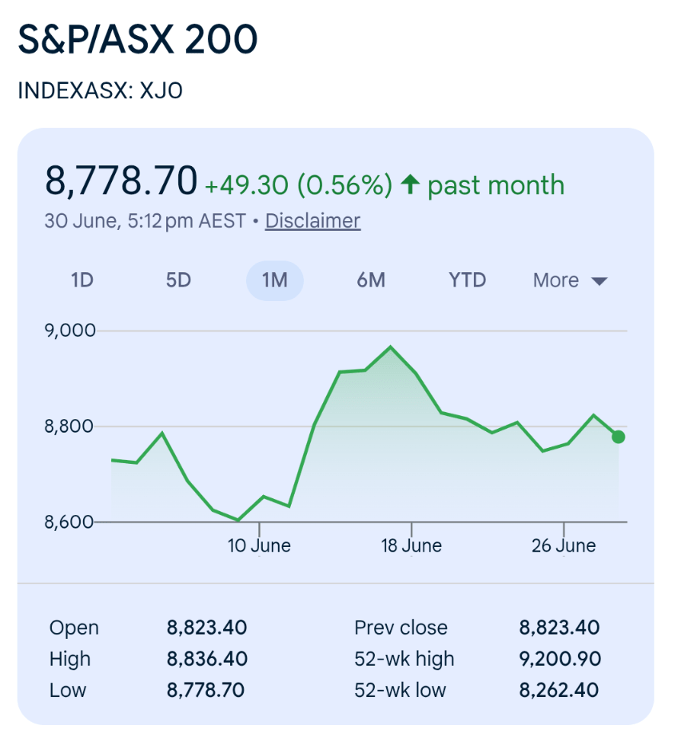
The major driver of the Australian market this month was the Reserve Bank of Australia meeting on June 16. The Monetary Policy Board decided to leave the official cash rate unchanged at 4.35 per cent. The RBA noted that while short-term inflation expectations had eased somewhat, underlying inflation remains too high, largely driven by elevated fuel prices passing through to broader goods and services. The central bank has faced a difficult year, having already hiked rates in February, March, and May to counter an acceleration in inflation.
Despite this challenging environment, the ASX 200 demonstrated notable resilience, supported heavily by the major banks. The primary drivers behind the local market's performance included:
- Financials (Banks): Bank stocks held up well due to strong credit conditions and resilient loan books, providing a relative safe harbour for investors.
- Defensive Sectors: Healthcare and consumer staples performed strongly. Consumers are shifting their spending toward essential goods, which has directly benefited large supermarket operators.
- Geopolitical Sensitivity: A temporary rise in the market around mid-June was spurred by hopes of de-escalation in the Middle East, highlighting how sensitive financial conditions remain to geopolitical events and energy prices.
On the downside, the index faced pressure from weakness in the technology, mining, and materials sectors.
The S&P 500: A Hawkish Surprise from the Fed
Turning to the United States, the following graph from Google Finance displays a tougher month for the S&P 500. The index experienced a sharp drop in the first half of the month, falling below 7,300 points around June 10. Despite a mid-month recovery attempt, it ultimately closed at 7,499.36, recording a loss of 1.32 per cent for the period.
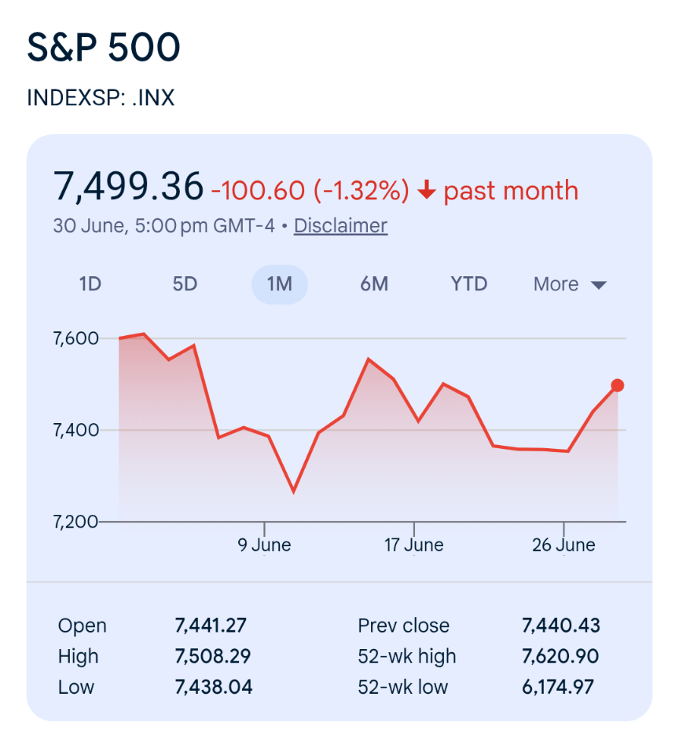
The turning point for the US market was the Federal Open Market Committee meeting on June 17, which marked the first session led by the newly appointed Fed Chair, Kevin Warsh. The FOMC voted unanimously to keep the target federal funds rate steady at 3.50 to 3.75 per cent. However, the messaging took a decidedly hawkish turn. Half of the committee members projected that rate hikes would be necessary later in the year, a stark shift from earlier expectations of potential cuts.
This hawkish stance was heavily influenced by persistent inflation concerns. The median projection for core Personal Consumption Expenditures inflation for 2026 was marked up to 3.3 per cent. High energy prices, exacerbated by the ongoing conflict with Iran, along with risks stemming from tariffs, have kept inflation firmly in the spotlight. Following the Fed's announcement, the S&P 500 retreated as investors absorbed the reality that interest rates might remain elevated or even rise, with technology stocks particularly feeling the pressure of this broader hawkish sentiment.
Final Thoughts on the Divergent Paths
The contrasting fortunes of the ASX 200 and the S&P 500 in June 2026 underscore how heavily market performance is tethered to central bank rhetoric. In Australia, the RBA's decision to pause rate hikes allowed the market to catch its breath. The defensive nature of the Australian equity market, heavily weighted towards robust financial institutions and consumer staples, provided a reliable buffer against ongoing cost-of-living pressures. It is a timely reminder that even in challenging economic times, sectors tied to everyday household necessities can offer vital stability.
Conversely, the US market faced a harsher reality check. The hawkish surprise from the Federal Reserve disrupted the market's hope that rate cuts were imminent, bringing inflation fears straight back to the forefront. For ordinary investors, this means the cost of borrowing may not decrease any time soon, affecting everything from mortgage rates to small business loans. The transition to a new Fed Chair has clearly signalled that price stability is the absolute priority, even if it causes short-term pain for equity valuations.
Ultimately, these divergent paths highlight the importance of geographical diversification in any investment strategy. While global energy prices and geopolitical conflicts affect both nations, their respective central banks and market compositions create entirely different investment environments. As we move further into the year, keeping a close eye on inflation data and the subsequent central bank responses will be more important than ever.
The Residential Property Market
For many Australians keeping a close eye on the property market, the weekend routine of attending open inspections and monitoring local auction results has felt distinctly different over the past few weeks. The frantic bidding wars that characterised recent years have given way to a quieter, more cautious environment. The latest comprehensive market data confirms that this shift is part of a broader, accelerating trend across the nation. The primary findings are sourced directly from the latest Cotality Home Value Index report, alongside consumer sentiment figures and market performance indicators.
The National Overview: The Downturn Broadens
The national property market experienced a significant shift at the end of the financial year. In June 2026, the national Home Value Index dropped by 0.4%. This decline represents the sharpest month-on-month fall the Australian housing sector has recorded since December 2022.
The latest figures also reveal that the national market reached its peak earlier in the year. Recent months have seen downward revisions, meaning the national index officially peaked in March 2026. Over the June quarter, national dwelling values dropped by 0.7%, indicating that the cooling trend observed during autumn has transformed into a more entrenched downturn.
Capital City Trends: Major Markets Drag Down the Index
The downward movement in national home values was primarily driven by substantial corrections in the largest capital cities. Across the combined capital cities, values dropped by 0.6% in June alone, culminating in a 1.3% loss over the June quarter.
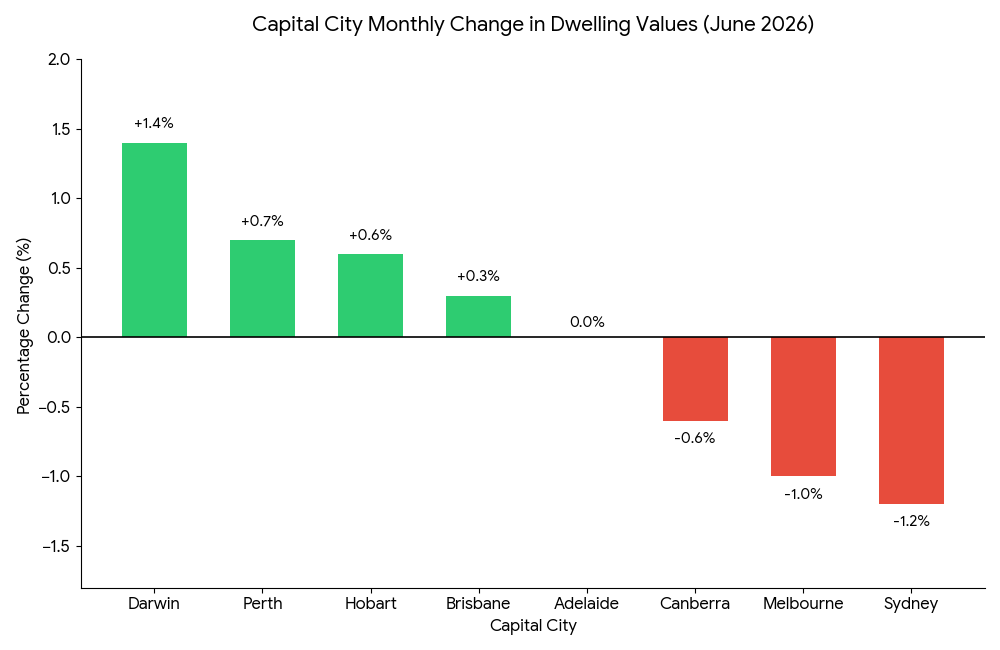
- Sydney: Serving as the heaviest drag on the national average, Sydney values fell 1.2% in June. This leaves the city 3.2% lower for the quarter and 3.7% below its January 2026 peak, with a current median of $1,265,608.
- Melbourne: Following a similar path, Melbourne values dropped 1.0% over the month and 2.6% for the quarter. This pushes annual growth down to -0.9% and the median to $808,486, representing a 4.0% drop from its March 2022 peak.
- Canberra: Conditions softened here too, with values dipping 0.6% in June and 1.3% over the quarter. The median now sits at $885,254, down 2.9% from its May 2022 high point.
- Adelaide: Monthly values flattened out entirely to 0.0%, though its annual performance remains strong at 11.6% with a median of $945,868.
- Brisbane and Perth: Brisbane crept up by 0.3% and Perth rose 0.7%. These modest gains are a sharp contrast to the start of the year, when monthly growth during the March quarter averaged 1.9% in Brisbane and 2.5% in Perth.
- Darwin and Hobart: Darwin bucked the cooling trend with a solid 1.4% monthly rise, while Hobart recorded a modest 0.6% increase.
Regional Markets Show Relative Resilience
Outside the metropolitan capital cities, regional property markets continued to outperform their urban counterparts, although their pace of growth is also slowing. The combined regional index rose by 0.3% in June, bringing quarterly gains to 1.1%.
Regional Western Australia remains the strongest regional sub-market in the country, posting a robust 3.7% gain over the June quarter. In contrast, regional Victoria recorded the weakest regional outcome with a 0.1% drop in June, while regional New South Wales home values remained unchanged over the month.
Affordability and Interest Rates
Even before the impact of the recent seventy-five basis point increase in interest rates, severe affordability and borrowing constraints were already dampening buyer enthusiasm. With the Reserve Bank of Australia holding the cash rate steady at 4.35% in June, buyers have been given temporary breathing space, but the threat of future tightening remains due to persistent inflation and a tight labour market.
Deepening Consumer Pessimism
Household confidence has taken a severe hit. The Westpac-Melbourne Institute Consumer Sentiment Index dropped by 2.9% in June. Families reported renewed pressures on household finances and lower expectations regarding future house price growth. This lack of confidence typically results in reduced market turnover as buyers delay major, long-term financial commitments.
Federal Budget Taxation Changes
Proposed changes to property taxation announced in the federal budget, specifically relating to negative gearing and capital gains tax settings, have introduced substantial uncertainty. Investors had been a primary source of demand in many property segments, but these upcoming policy adjustments are expected to trigger a significant pullback in investor activity for established dwellings.
Transaction Metrics: Supply and Demand Mismatch
The shifting balance of power between buyers and sellers is clearly visible in high-frequency trading metrics.
- Auction Clearance Rates: The combined capital cities auction clearance rate dropped below the 50% mark in late May and weakened further into the low 40% range by the end of June. These figures represent results well below historical decade averages.
- Declining Sales Volumes: Estimated capital city home sales over the three months to June were 16.2% lower than the same period last year, and 14.5% below the established five-year average for winter.
- Rising Advertised Inventory: Total advertised listings across the capital cities are now roughly equal to the five-year average (-0.1%) but sit almost 11% higher than a year ago. This accumulation of stock is not caused by a sudden influx of new properties entering the market, but rather by properties taking longer to sell as buyer demand evaporates.
The Rental Market and Gross Yields
In contrast to the stalling purchase market, the residential rental sector remains highly competitive. Cotality's national rental index grew by 0.5% in seasonally adjusted terms during June, consistent with the 0.5% growth recorded in May. Over the full financial year, national rental prices increased by 5.9%, adding an average of $40 per week to median household rental costs.
This continuous growth is driven by extremely low rental vacancy rates, which sat at 1.6% in June. While this is a marginal lift from the 1.5% recorded in May, it remains far below the long-term decade average of 2.5%.
Because rental prices are rising while housing values soften, gross rental yields are experiencing a gradual increase. Across the combined capital cities, the average gross rental yield rose to 3.50%. This is up from the cyclical low of 3.34% recorded in December last year. Despite the improvement, analysts point out that average variable mortgage rates for new investor loans hover around 6.4%. When factoring in rising costs for insurance, property maintenance, and strata fees, cash-flow positive opportunities remain exceptionally rare for leveraged investors.
Market Outlook
The Australian residential property sector enters the second half of 2026 on a cautious path. Industry experts suggest that a severe national property crash remains unlikely, as low levels of new housing construction, a stable job market, and ongoing population growth will continue to provide a baseline floor for pricing.
However, a further loss of momentum and a gradual drift lower in values is the most probable outlook for the coming months. For buyers with secure employment and a healthy deposit, the expanding choice of listings and softer auction environments are providing the most balanced negotiating conditions seen in several years.
Inflation and Interest Rates
After a difficult start to the year that saw three consecutive interest rate increases, there was finally some relief for mortgage holders. At its meeting on 16 June 2026, the RBA Board announced a unanimous decision to leave the cash rate target unchanged at 4.35 per cent (Reserve Bank of Australia, 2026).
This decision to hold the rate steady suggests that the central bank is waiting to see how the economy reacts to the earlier increases. According to the RBA, financial conditions have tightened and there are early signs that consumer spending is slowing down. Essentially, the medicine they applied earlier in the year appears to be working. However, they also noted that inflation remains "too high", meaning further increases have not been completely ruled out if prices begin to surge again.
To understand the RBA's cautious approach, we need to examine the latest cost of living data. Late last month, the Australian Bureau of Statistics (2026) released the Consumer Price Index (CPI) figures for May 2026, and the results presented a mixed bag.
On the surface, the news is positive. The annual headline inflation rate dropped to 4.0 per cent in May, down from 4.2 per cent in April. This drop was largely driven by falling automotive fuel prices, providing some welcome relief at the petrol pump.
However, economists tend to look past the headline number and focus on "trimmed mean" inflation. This measure strips away the most extreme price changes to show the underlying trend. Unfortunately, the ABS (2026) reported that trimmed mean annual inflation actually rose to 3.6 per cent in May, up from 3.4 per cent in April. This tells us that while petrol might be cheaper, the core, everyday expenses are still stubbornly high and sitting well above the RBA's target range of 2 to 3 per cent.
What exactly is keeping that underlying inflation figure so high? The ABS (2026) data highlights a few specific areas that are hitting Australians the hardest right now:
- Housing Costs: Housing remains the most significant contributor to inflation, rising by 6.5 per cent over the past year. This increase is driven by higher rent prices and the cost of building new dwellings.
- Electricity Bills: The cost of keeping the lights and heaters on has become a major pain point. Electricity costs were 21.1 per cent higher in May 2026 than they were a year earlier, largely because previous government rebates have ended.
- Food and Dining: Annual inflation for food and non-alcoholic beverages sat at 3.3 per cent, with the cost of meals out and takeaway food rising by 4.0 per cent.
We find ourselves in a delicate holding pattern. The RBA is attempting to slow the economy down enough to stop prices from rising, without causing undue harm to everyday households. For now, the decision to hold interest rates at 4.35 per cent provides a brief moment to breathe and plan.
As we move deeper into winter, careful budgeting remains highly important. With underlying inflation still proving difficult to tame and electricity prices notably high, finding small ways to reduce daily expenses can make a significant difference. We will continue to monitor these developments and keep you updated with the latest reliable information as the year progresses.