
The Share Market
When we examine the market performance for May 2026, we see a textbook example of how two major global indices can absorb the exact same macroeconomic shocks yet chart entirely divergent courses. Let's explore exactly what drove these distinct outcomes across the United States and Australia.
The S&P/ASX 200: Rate Hikes and Budget Blues
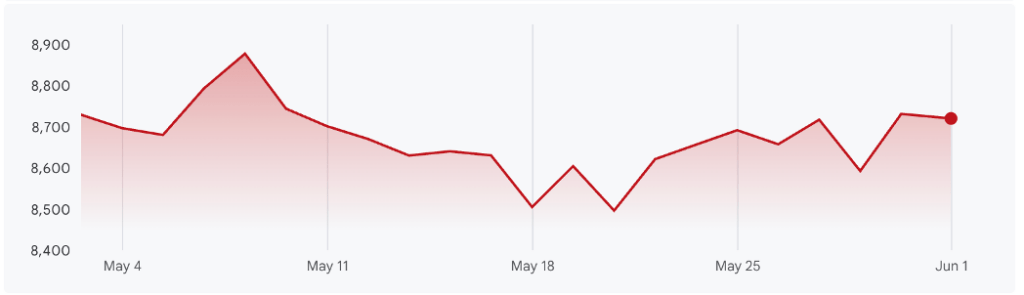
ASX 200 Performance in May 2026 - Google Finance
The Australian equity market endured a highly volatile and ultimately disappointing month. As depicted in the accompanying graph above, the S&P/ASX 200 opened the period near 8,730 points, with the chart tracking the price action through to 1 June. The chart indicates the index ultimately finished the period down 0.19 per cent at 8,713.20. While the market saw a temporary recovery around May 29 where it hovered near 8,731.70, it failed to maintain that momentum as the month wrapped up. The overriding sentiment across the entire period was undoubtedly one of turbulence.
The month began with intense focus on the central bank. On May 5, the Reserve Bank of Australia raised the official cash rate by 25 basis points to 4.35 per cent. The Monetary Policy Board voted 8 to 1 in favour of the hike. They cited persistent underlying inflation that had picked up to 3.5 per cent over the year to the March quarter, alongside inflationary pressures stemming from the Middle East conflict. The Board explicitly noted that higher fuel prices were likely to have second-round effects on the prices of goods and services more broadly, an assessment detailed by Westpac IQ.
Interestingly, the local market seemed to absorb the rate hike with surprising resilience initially, climbing to a peak around May 9. However, this optimism was short-lived. The definitive turning point for the ASX 200 occurred on May 12, coinciding with the delivery of the 2026-27 Federal Budget by Treasurer Jim Chalmers. The budget introduced generational changes to the taxation of housing. Rather than scrapping negative gearing entirely, the government restricted the policy to new builds from 1 July 2027 to focus tax support on new supply, grandfathering existing properties. Furthermore, the capital gains tax discount was replaced with indexation.
While the government forecast a small underlying cash deficit of $31.5 billion for the upcoming financial year, a figure confirmed by CommBank, economists judged the stance of fiscal policy to be neutral to mildly expansionary. The market reaction was swift and severe. Following the budget announcement, the ASX 200 plunged precipitously, shedding points consistently until it reached a deep trough around May 18. This sharp sell-off was driven by a collective realisation that the federal budget did little to help the Reserve Bank in its fight against inflation. By introducing an expansionary fiscal policy at a time when monetary policy was actively trying to cool the economy, the government effectively increased the likelihood of further interest rate hikes.
For the remainder of the month, the ASX 200 experienced choppy trading. Although it managed a partial recovery towards May 25, the index struggled to sustain momentum. The Australian market was caught in a perfect storm of tightening monetary policy, sweeping structural tax reforms, and a domestic economy struggling to absorb the shock of global energy prices. Unlike the US market, which possessed the massive gravitational pull of the technology sector to offset macroeconomic woes, the resource-heavy and bank-heavy Australian market had nowhere to hide.
The S&P 500: Riding the Earnings Boom
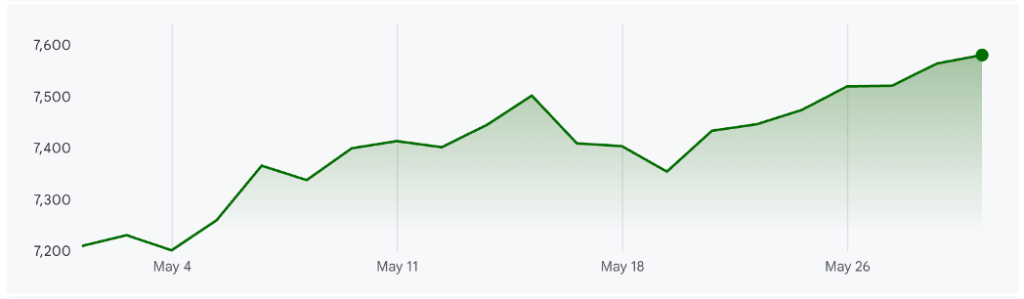
S&P 500 Performance in May 2026 - Google Finance
Turning our attention to the United States, the month of May 2026 was a stellar period for the US equity market, as evidenced by the S&P 500 chart provided in the graph below. Opening the month near 7,200 points, the index experienced a brief dip around May 4. This initial hesitation reflected investor apprehension following the Federal Open Market Committee meeting on April 29.
The meeting was particularly notable as it marked Jerome Powell's final session as Chairman, and it concluded with an unusually high four dissents among members. The central bank chose to hold interest rates steady, largely because core Personal Consumption Expenditures inflation remained stubbornly high at 3.3 per cent in March. It is important to clarify that the dissents were not uniform in direction. Only one policymaker, Fed Governor Stephen Miran, opposed the decision to pause rates, favouring an immediate rate cut. The other three dissenting policymakers opposed what they called the easing bias in the statement, signalling their disagreement with its dovish tone. This complex policy dynamic was highlighted by the US Chamber of Commerce.
Following this early dip, the S&P 500 began a powerful ascent, reaching a local peak around May 11. This rally was fundamentally driven by an extraordinary first-quarter earnings season. Approximately 84 per cent of reporting S&P 500 companies beat earnings per share estimates, putting the index on track for a sixth consecutive quarter of double-digit earnings growth. Corporate earnings provided substantive validation of the fundamental case for US equities, heavily supported by the information technology sector, which posted a staggering net margin of 29.1 per cent. Fuelled by surging demand for artificial intelligence, semiconductor stocks experienced a parabolic advance relative to the broader market.
However, the path was not entirely smooth. Between May 16 and May 19, the index dropped sharply to a mid-month trough. This sudden sell-off coincided with escalating fears regarding the geopolitical environment in the Middle East. The closure of the Strait of Hormuz effectively removed nearly 13 million barrels per day of global oil supply. This massive energy shock reignited fears of entrenched inflation, leaving the Federal Reserve with a severe dual-mandate conflict. Investors temporarily panicked, fearing that elevated energy costs would seep into broader inflation expectations and further delay any prospective rate cuts.
Despite these formidable headwinds, the market quickly found its footing. From May 20 onwards, the S&P 500 rallied relentlessly to close the month at 7,580.06, securing a remarkable 5.15 per cent gain over the one-month period. This phenomenal recovery was aided by news of a US-Iran ceasefire extension, reported by MarketPulse, which prompted a swift positive response across global financial markets and provided hope that energy disruptions might begin to ease. Investors shifted from pricing in escalation risks to cautiously pricing in stabilisation, allowing them to focus entirely on the unprecedented earnings boom.
Final Thoughts on the Divergent Paths
The striking divergence between the S&P 500 and the S&P/ASX 200 throughout May 2026 highlights a fundamental truth about modern investing: global market integration has its limits when local economic realities take over. For months, the prevailing narrative was that a rising tide of technological innovation would lift all global equities. However, the events of May proved that a nation's underlying economic architecture dictates how it absorbs international shocks. While the United States benefited from an insulated, high-margin technology sector that essentially acted as a buffer against geopolitical friction, Australia’s heavy concentration in banking and materials left it fully exposed to domestic headwinds. When global energy pressures mounted, the two markets responded through entirely different lenses.
From an investor psychology perspective, this period offered a fascinating lesson in how domestic policy changes can rapidly freeze local sentiment. In Australia, the sweeping structural adjustments to property taxation introduced in the federal budget created an immediate air of caution, compounding the discomfort of an aggressive Reserve Bank of Australia interest rate hike. It is a relatable reminder that while global trends provide the background noise, it is often local legislative shifts and the cost of borrowing that hit closest to home for everyday investors. This friction caused a distinct disconnect from the unyielding optimism observed on Wall Street, where robust corporate earnings consistently overshadowed central bank disagreements and sticky inflation data.
Looking ahead through the remainder of 2026, these contrasting performances underscore the need for a balanced approach to geographic asset allocation. Relying solely on a single market's momentum can expose a portfolio to unforeseen localized risks, whether that takes the form of regulatory overhauls in Canberra or an earnings slowdown in New York. The starkly different outcomes of this month demonstrate that understanding the interplay between a government's spending and a central bank's tightening cycle is vital. For those watching the markets, May served as a clear signal that domestic policy choices will continue to carve out vastly different paths for wealth creation on either side of the Pacific.
The Residential Property Market
Reviewing the latest property listings can often feel like a full-time job. The intense competition that characterised much of the past few years has certainly settled down. The figures from May 2026 illustrate a market that is slowing down considerably, and the data confirms what many buyers and sellers have been experiencing recently.
Following a noticeable cooling trend in April, the final month of autumn brought the overall national market to a virtual standstill. To properly understand this shift, we must examine the figures directly. As requested, the analysis below is based entirely on reliable, published data from respected market analysts, specifically Cotality and PropTrack.
As we moved through May 2026, the national property market effectively paused. According to Cotality, the national Home Value Index was entirely flat, recording a 0.0% change for the month. PropTrack data showed a very similar picture, with their index recording a tiny national decrease of 0.04%.
While a flat national result might sound stable, it actually hides a completely divided market. We are seeing incredibly diverse conditions across the country. Demand is weakening as buyers face intense economic pressures, and the direction of the market is becoming more consistent across different regions, even if the speed of the change varies greatly.
The Largest Capitals Lead the Downturn
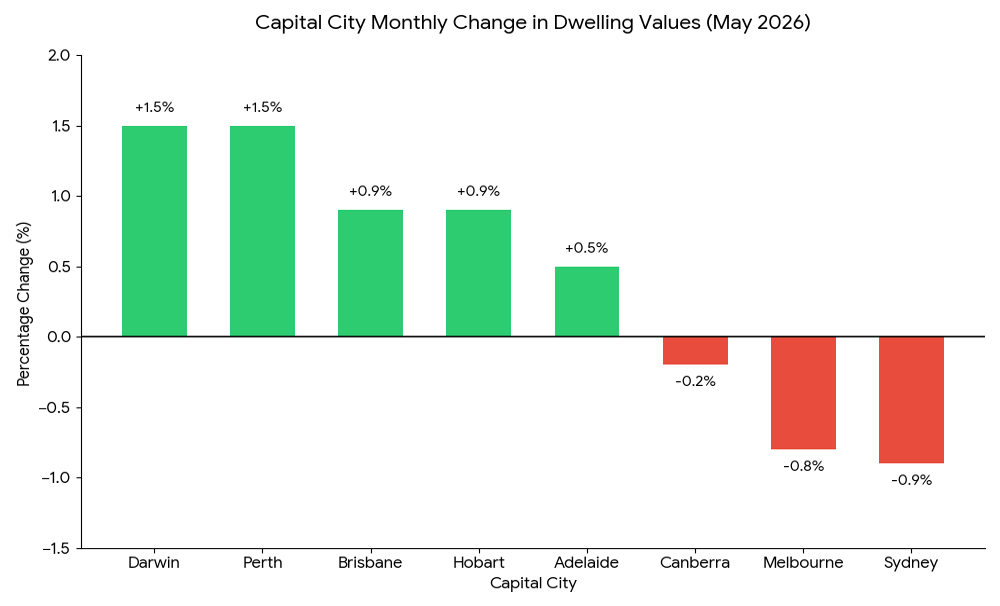
The slowdown is being driven heavily by our two largest cities. Throughout May, dwelling values in Sydney fell by 0.9%, while Melbourne saw a drop of 0.8%, according to Cotality. PropTrack also recorded declines for both cities, noting a 0.2% drop in Sydney and Melbourne, which marks their third consecutive month of negative growth.
Perhaps the most striking figure from the May data is the change in Melbourne housing prices. PropTrack reported that the median house price in Melbourne has fallen below the one million dollar mark, now sitting at $995,000. The broader Melbourne dwelling median is now $846,000, a figure that has barely moved over the past four years due to a high volume of stock on the market.
When looking at recent peaks, the two major indices provide different perspectives based on their measurement periods. According to PropTrack, the modest declines in Sydney and Melbourne mean prices in both cities are only 1.2% below where they sat in March. Meanwhile, Cotality measures from an earlier high, reporting that home values in Sydney are now 2.1% below the peak they reached in November last year, and Melbourne values are down 2.9% from their own November peak.
Regional and Mid-Sized Capital Strength
While the biggest cities are retreating, other parts of the country are moving in the opposite direction. The housing sector is currently defined by multi-speed conditions, with Perth and Melbourne sitting at complete opposite ends of the spectrum.
In May, Perth and Darwin led the capital cities in growth according to Cotality, with property values rising by 1.5% in both locations. Brisbane and Hobart also saw healthy gains of 0.9%, and Adelaide recorded a 0.5% rise.
However, it is worth noting that even these high performing markets are starting to show signs of slowing. PropTrack data indicated that Perth actually saw a very minor decline of 0.1% in May. While this is a tiny drop, it represents the first monthly decline for the western capital since late 2024, although Perth prices remain an impressive 20.6% higher than they were a year ago. Adelaide and Darwin were highlighted by PropTrack as their top performing capitals with 0.3% growth, though this also represents a slowdown from previous months.
Regional Markets Show Resilience
Outside of the major cities, regional areas are generally holding up better than their metropolitan counterparts. Housing values rose by 0.6% across combined regional areas in May according to Cotality, though this was the smallest monthly rise recorded in a year. PropTrack noted a similar trend, recording a 0.2% monthly growth for regional areas, which they identified as the slowest pace since 2023.
Every broad regional market recorded positive growth according to Cotality, with Regional Western Australia leading the way with a 1.9% monthly gain. In contrast, Regional New South Wales saw the smallest increase at just 0.2%. It is clear that while regional markets remain resilient, the overall slowing trend is beginning to reach these areas too.
May 2026 Capital City Performance
Below is a snapshot of how the major markets performed up to the end of May 2026, based strictly on Cotality data:
As we head further into the winter months of 2026, the Australian property sector is presenting a highly fragmented picture. The intense growth of the past few years appears to be over, replaced by a market where local dynamics dictate everything. Buyers in Sydney and Melbourne currently have more choice and less competition, while those in cities like Perth and Brisbane are still facing a tighter market, albeit one that is slowly cooling. It is a time for careful consideration and thorough research before making any major property decisions.
Inflation and Interest Rates
Last month, we discussed the Reserve Bank of Australia (RBA) raising the official cash rate to 4.35 per cent. A few weeks have passed since that announcement, and we now have fresh data to help us understand where the Australian economy is heading. If you are feeling the chill of higher grocery and energy bills, you are certainly not alone.
To get a clear picture of our economy, we look closely at inflation, which measures how fast the prices of everyday goods and services are rising. Late last month, the Australian Bureau of Statistics released their latest Monthly CPI.
The data showed some positive news on the surface. Annual CPI inflation eased to 4.20 per cent in the 12 months to April 2026, dropping down from 4.60 per cent in March. While a decrease in the headline figure is welcome, economists remain focused on another underlying measure known as trimmed mean inflation. This specific metric removes the most extreme price changes to reveal core trends. According to the Australian Bureau of Statistics, trimmed mean annual inflation actually rose slightly to 3.40 per cent in April, up from 3.30 per cent in March. This slight increase highlights sticky inflation, meaning underlying prices are remaining stubbornly high instead of falling back to the RBA's target range of 2 to 3 per cent.
Following the RBA decision on 5 May 2026 to increase the cash rate, the official interest rate currently sits at 4.35 per cent. As outlined by the RBA, this elevated rate aims to manage those sticky inflation figures.
The central bank will meet again in mid-June to review the cash rate, and predictions are currently divided. While three of the four major banks forecast that the RBA will pause and hold the rate steady at 4.35 per cent to assess the impact of previous increases, this is not a settled consensus. Notably, economists at Westpac have stated their base case is a further rate hike to 4.60 per cent. Because underlying inflation risks are still present, another rate increase remains a live possibility that households should be prepared for.
Understanding these national figures is helpful, but what really matters is how they affect your wallet. Here are a few practical impacts you might notice:
- Mortgage Repayments: If you have a variable home loan, you have likely already received a letter from your bank confirming your new, higher minimum repayment amount following the May rate hike.
- Winter Energy Bills: With inflation heavily tied to global fuel and energy costs, you might see higher than usual electricity and gas bills this winter. It is a very good time to check if your energy provider is offering the most competitive rate in your area.
- Savings Accounts: On a slightly brighter note, the higher cash rate means that many banks have increased the interest they pay on savings accounts. If you have some money put away, check to ensure your bank is passing these higher returns onto you.
Managing household finances can feel like a heavy task right now. The combination of sticky underlying inflation and high borrowing costs requires careful budgeting. The primary goal of these higher interest rates is to slow down overall spending enough so that everyday prices stop climbing so rapidly. Stay warm and take the time to review your household budget as we move into the second half of the year.