

The Share Market
Australia was the stronger sharemarket in October: the S&P/ASX 200 rose 3.41% from the first trading-day close to the last, while the S&P 500 fell 1.13%. On the conventional calendar-month measure, which includes the opening session’s move from 30 September, Australia gained 1.35% and the US lost 0.93%. These are price-index returns excluding dividends. The contrast reflects two different paths: an Australian recovery from a weak start and an early US rally that ultimately unravelled.
S&P ASX 200 performance
The ASX 200 closed 1 October at 8,614.40 and 30 October at 8,908.10, an increase of 293.70 points. Those sessions also established the month’s closing low and high respectively. The 293.70-point closing range was 3.41% of the low. The first session fell 1.99% from September’s final close of 8,789.30, the largest daily decline of October. Excluding that loss explains why the first-to-last return looks considerably stronger than the full calendar-month gain.
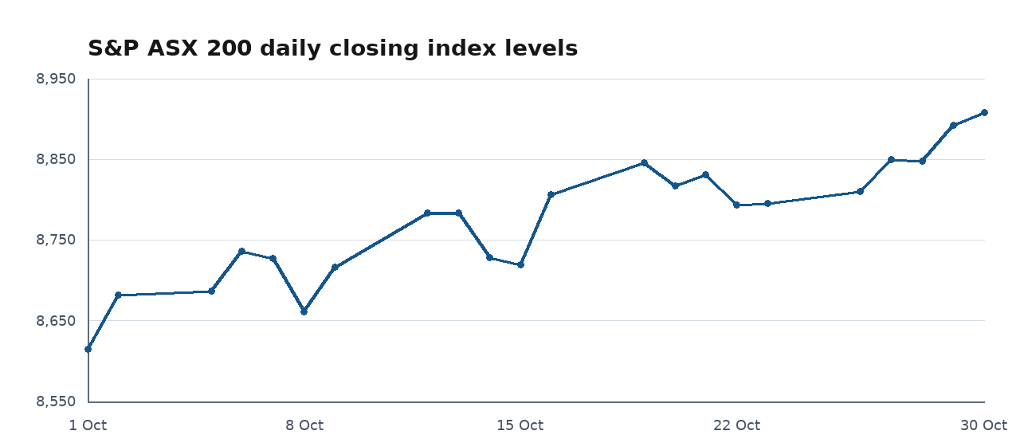
The recovery was uneven. After gains on 2, 5 and 6 October were interrupted by a decline on 7 October, the benchmark fell to 8,660.90 on 8 October. It then recovered to 8,783.90 on 13 October, slipped over the following two sessions and jumped 1.00% on 16 October, its largest daily percentage rise. It ended that session at 8,806.70. The final week added further ground, despite a small setback on 28 October, and the month finished at its highest close. This sequence shows that the opening shock was eventually recovered, rather than describing an uninterrupted advance.
Contemporaneous Reuters reporting on 1 October identified banks and miners as leading broad selling during the session. Its 14 October report again linked weakness in those sectors to inflation concerns following the RBA minutes. Both were intraday accounts, so their quoted index levels should not be confused with final closes. The week ending 16 October brought a different balance: reporting described bank support and a Friday rebound in BHP. These observations help explain particular phases, but they do not provide a complete sector attribution for the monthly return. The cash rate was unchanged during October; investors were reassessing the next decision.
S&P 500 performance
The S&P 500 began at 7,666.45 on 1 October and finished at 7,580.07 on 30 October, a loss of 86.38 points or 1.13%. Against the 30 September close of 7,651.54, its calendar-month decline was 0.93%. Its closing high was 7,818.93 on 6 October and its closing low was the final session. The 238.86-point closing range equalled 3.15% of the low. The largest daily rise was 0.73% on 2 October; the largest fall was 1.82% on 30 October.
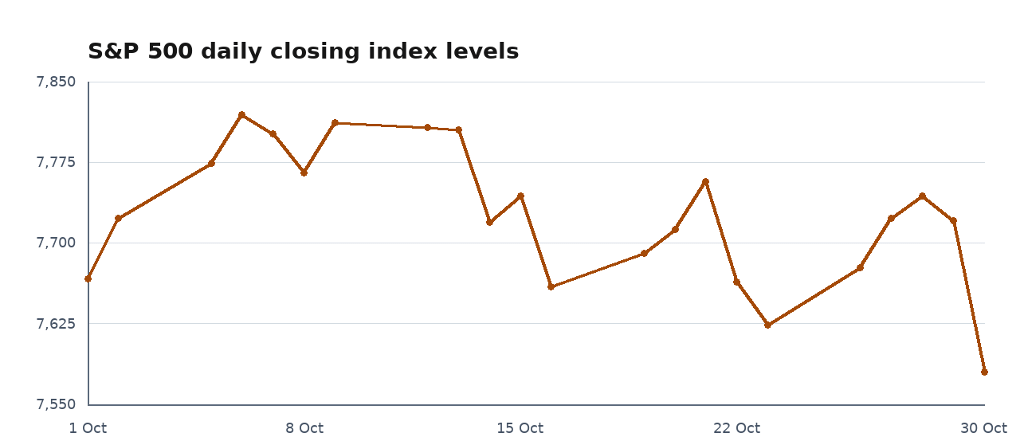
The opening advance carried the index higher in each of its first four sessions. Reuters’ 6 October reporting described easing Treasury yields, lower oil prices and optimism about corporate earnings and artificial intelligence investment. The next day’s report described renewed pressure as long-term yields climbed. The economic mechanism is familiar: higher bond yields make competing fixed-income returns more attractive and reduce the present value assigned to distant corporate earnings. That matters for highly valued growth companies, although changes in yields alone cannot establish why every share or session moved.
The index stayed near its early high through 13 October before declines on 14 and 16 October interrupted the rally. A recovery reached 7,757.17 on 21 October, followed by another reversal on 22 and 23 October. It rebounded to 7,743.98 on 28 October, when the Federal Reserve left its target range at 3.75% to 4.00%. The announcement came at 2 pm New York time, before that session’s close and well after Australia’s trading day. The Fed described strong activity and elevated inflation. Holding the policy rate therefore did not amount to a promise of easier financial conditions.
The final-session fall erased the remaining monthly gain. AP’s 30 October account identified selling in artificial intelligence stocks and disappointing company developments, with Nvidia a major drag. That session’s 140.32-point fall came while the US ten-year Treasury yield eased to 4.93%. The combination is a useful reminder that shares can fall even as yields decline when earnings or valuation concerns dominate. The index’s 3.05% fall from its 6 October closing high to month-end is a time-ordered decline; its 3.15% high-to-low range uses the low as denominator. Neither measure describes intraday extremes.
Direct comparison of the markets
Australia led the first-to-last comparison by 4.54 percentage points and the calendar-month comparison by 2.29 percentage points, calculated before rounding. The difference between those gaps is largely the opening session: the ASX suffered a substantial fall while the S&P 500 rose slightly. Comparing only the two October endpoints gives a valid account of the observed sequence, but leaves out that first day’s investor experience. Comparing consecutive month-ends captures it. Readers should use the same definition when comparing either result with a fund or portfolio statement.
The indices also represent different business exposures. Australia’s benchmark gives banks and resources an influential role, while large US technology companies are prominent in the S&P 500. Banks face a mixture of interest-income opportunities, funding costs and credit-quality risks. Miners respond to commodity prices and global demand, while technology valuations can be sensitive to financing costs and expectations of future growth. These are transmission channels, rather than measured October sector contributions. Company earnings, investor positioning and currency changes can pull in different directions, so a national economic headline is rarely a sufficient explanation for the whole index.
The closing ranges were quite similar in percentage terms, yet their timing differed sharply. Australia’s low came first and its high last; the US reached its high early and its low last. An investor looking only at the final monthly percentages would miss those different experiences. The comparison is in each index’s domestic units and contains no currency conversion. An Australian investor’s unhedged US investment return also depends on the Australian dollar, while actual portfolios include fees, distributions and holdings that differ from the benchmark. Index performance is therefore a reference point rather than a personal investment outcome.
Implications and watchpoints
October’s evidence supports watching both earnings delivery and the cost of capital. US technology businesses need to demonstrate that investment can translate into durable cash generation, while Australian banks and resources remain exposed to household conditions and global demand respectively. Energy prices are another link between markets and inflation: sustained increases can lift business costs and complicate policy decisions. Diversification can reduce reliance on one sector or market, but cannot prevent losses across a portfolio. November’s RBA increase and company updates can change expectations; neither October’s Australian rebound nor the US retreat establishes the direction of the next month.
The Residential Property Market
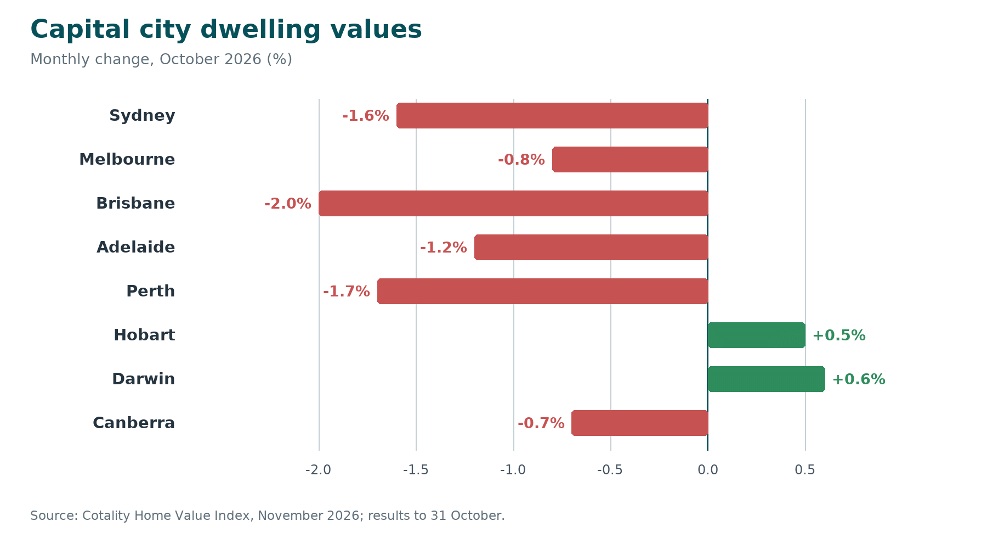
Australian dwelling values fell 1.2% in October, the seventh consecutive monthly decline. Cotality’s November Home Value Index, published on 2 November with results to 31 October, showed six capitals falling while Darwin and Hobart rose. Limited housing supply continued to provide support, but weaker borrowing capacity and buyer confidence weighed on demand.
National values fell 3.9% over the quarter and 2.8% over the year, leaving the median dwelling value at $884,855. Values were 6.7% below their March peak, equivalent to an approximately $63,400 reduction in the median dwelling’s value. The quarterly decline gives a clearer picture of recent momentum than the annual result, which still includes earlier gains.
Cotality’s hedonic index adjusts for differences in the homes sold. Earlier observations can be revised as sales information arrives, so this edition consistently uses the November report. Median values describe broad markets, rather than an individual property’s likely sale price.
Combined capital-city values fell 1.4% in October, 4.5% over the quarter and 4.8% over the year. Their median value was $954,905, with the index 8.1% below its March peak. The downturn was broadening across markets that had previously followed different paths.
Source: Cotality Home Value Index, November 2026
Brisbane led the monthly falls at 2.0%, followed by Perth at 1.7% and Sydney at 1.6%. Adelaide fell 1.2%, Melbourne 0.8% and Canberra 0.7%. Darwin rose 0.6% and Hobart 0.5%. Quarterly declines reached 6.1% in Brisbane, 5.7% in Perth and 4.7% in Sydney, showing that earlier strong performers were also losing ground.
Annual results remained uneven: Darwin was up 9.7%, Hobart 5.5%, Perth 3.9%, Adelaide 3.7% and Brisbane 0.4%. Sydney was down 9.4%, Melbourne 7.6% and Canberra 3.7%. A positive annual result can therefore coexist with a substantial recent decline, particularly where earlier gains were strong.
Regional markets
Combined regional values fell 0.7% in October and 2.0% over the quarter, while remaining 3.4% higher annually. The median was $752,960. Regional Queensland fell 0.9%, New South Wales 0.7% and Victoria 0.6%; South Australia, Western Australia and Tasmania each fell 0.3%. No comparable all-dwellings figure was published for regional Northern Territory.
Regions outperformed capitals by 0.7 percentage points during October, but all six published state aggregates declined. That relative resilience should not be mistaken for renewed growth. Local employment, affordability and property type remain relevant when assessing a particular market.
Demand and selling conditions
Cotality estimates national sales over the past three months were 23% below a year earlier and 18% below the preceding five-year average. Sydney and Brisbane recorded especially large annual falls in sales, at 30% and 29% respectively. These are modelled estimates of activity. Fewer completed sales mean sellers face a smaller active buyer pool and may need longer marketing campaigns, even if many owners choose not to list. Turnover and prices are related signals, but neither alone shows how much financial pressure any particular seller faces.
The report says new capital-city listings were almost 18% below average, yet total advertised stock was at its highest seasonal level since 2019. Slower absorption explains how those conditions can coexist. Median selling time was 39 days and vendor discounting 4.7%. For sellers, realistic pricing and an allowance for longer selling periods become more relevant. For buyers, greater choice can improve negotiating conditions, but a lower purchase price may be offset by higher financing costs. A larger stock of listings should not automatically be interpreted as a wave of forced sales.
Rental conditions and outlook
Rental markets were also easing. Cotality’s national vacancy rate reached 2.3%, while national rents rose 0.9% over three months on a seasonally adjusted basis. Gross capital-city rental yields were about 3.8%, with falling values and rising rents lifting the ratio. A gross yield excludes interest, maintenance, insurance, management and other ownership costs, so it is not a measure of cash left over. Softer rent growth can reduce prospective income gains even while the yield rises mechanically as property values fall.
Cotality’s 2 November outlook anticipates further downward pressure into 2027, while identifying constrained new supply as a source of support. That is an attributed outlook, not a certainty. The RBA’s October Financial Stability Review separately assessed most indebted households and businesses as well placed to manage softer growth and lower house prices. Financial resilience does not prevent a market correction, but it distinguishes a decline in values from widespread repayment failure. The property outlook depends on financing conditions, incomes and willingness to transact, as well as construction.
Evidence of stabilisation would need to include firmer sales absorption and less widespread price weakness. Borrowing costs and household incomes remain central: a negotiable purchase price does not necessarily mean comfortable repayments. October improved buyers’ choice while continuing to test affordability.
Inflation and Interest Rates
October policy and the November update
The RBA did not meet in October. At month-end, the cash-rate target was 4.60%, following the unanimous September increase. Four increases during 2026 had added 100 basis points. The September minutes, released on 13 October, highlighted the risk that global cost shocks and domestic capacity pressures would prolong inflation.
In its 3 November decision, the RBA raised the target by 25 basis points to 4.85%, effective 4 November. Six Board members supported the increase and three preferred no change. This fifth increase of 2026 brings cumulative tightening to 125 basis points. The Board cited persistent inflation, tighter capacity pressures and fuel costs spreading into other prices. Its updated outlook has inflation returning to the top of the target band only in late 2027. Further tightening was judged necessary despite slower activity and falling housing prices. This decision occurred after the October review period.
Inflation and rate expectations
The ABS released September CPI data on 28 October. Annual headline inflation rose to 4.3%, from 4.0% in August. Prices rose 0.8% in September in original terms, or 0.6% seasonally adjusted; the September-quarter increase was 1.3%. These were the latest inflation results available at October’s end, rather than a reading of October prices.
Housing and transport were the largest annual contributors, rising 5.2% and 8.7% respectively. Automotive fuel increased 9.4% in September and 23.6% annually. Electricity was 12.8% higher over the year, largely reflecting the withdrawal of Commonwealth rebates. That withdrawal lifts measured household costs even without an equivalent new increase in supply costs.
Annual trimmed mean inflation was 3.6%, compared with a revised 3.5% in August; the monthly increase was 0.3%. The separately reported quarterly trimmed mean rose 1.0% on the older methodology. Underlying inflation remained above the RBA’s 2% to 3% target. Fuel’s unusually large movement was excluded from September’s trimmed mean, although it still affected household budgets.
RBA communications during October warned of a worse inflation outlook. ABC’s 28 October reporting put the market-implied chance of a November increase at about 60% before the CPI release and 90% afterwards. Those were dated market estimates, not an RBA commitment. The Board also needed to consider the delayed effects of earlier increases on spending and activity.
Household implications
Borrowers should assess repayments, living costs and a buffer for changes in rates or income. Lenders need not pass cash-rate changes through in full or immediately; refinancing also involves fees and eligibility checks. Savers should compare deposit conditions and inflation’s effect on purchasing power. A realistic budget remains useful as higher rates flow through to household finances. These are general educational considerations.