The Share Market
April 2026 was a month that reminded investors just how differently two markets can respond to the same global events. The S&P 500 delivered its best monthly performance since November 2020, surging more than 10% to close at record highs above 7,100 points. Australia's ASX 200, meanwhile, spent the month fighting a losing battle with oil prices and geopolitical anxiety, ending April essentially flat at 8,665.80, down just 0.07%.
The same war in the Middle East. The same elevated oil prices. The same global uncertainty. Two completely different charts.
The ASX 200: A Volatile Month That Went Nowhere
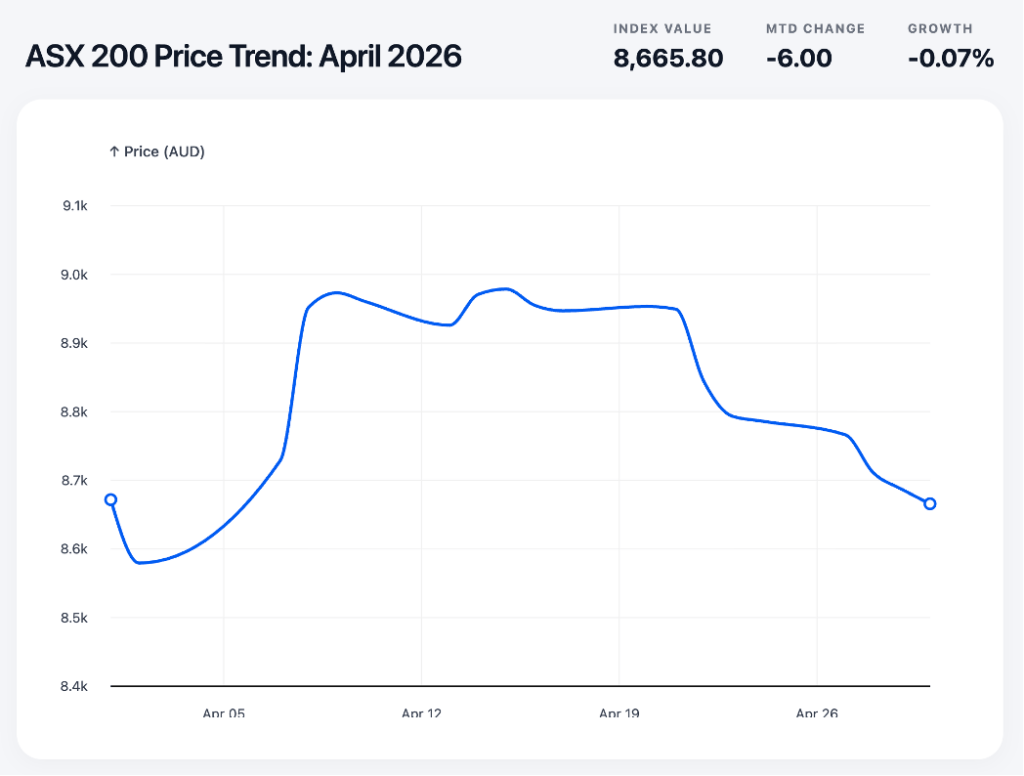
Source: Based on Data from Yahoo Finance
The local market opened April around 8,670 points and immediately dipped lower, with investors still anxious about the conflict's impact on energy costs and global growth. The mood shifted sharply when markets reopened after the Easter long weekend on 7 April. Australian investors had missed nearly 2% in Wall Street gains while the exchange was closed, and that optimism came flooding in at once. The ASX 200 surged 224 points at the open, driven largely by short-covering, with mining stocks leading the charge after Chinese steel mills were cleared to resume buying BHP iron ore cargoes.
The index pushed towards 8,950 through mid-April, buoyed by ceasefire signals from the US and Iran, firm copper prices, and solid quarterly production numbers from BHP. But the recovery stalled there. When Iran closed the Strait again after a brief reopening, energy stocks fell sharply. Fortescue then compounded the damage, reporting iron ore shipments of 48.4 million tonnes for the March quarter, down 4% on the prior period, alongside a surprise US$680 million green energy spending announcement that unnerved investors. The Federal Reserve's decision on 29 April to hold rates steady for a third consecutive time, in what was Jerome Powell's final meeting as chair, offered no relief. Eight consecutive losing sessions followed, and the index gave back nearly everything it had gained.
The S&P 500: Records All Month
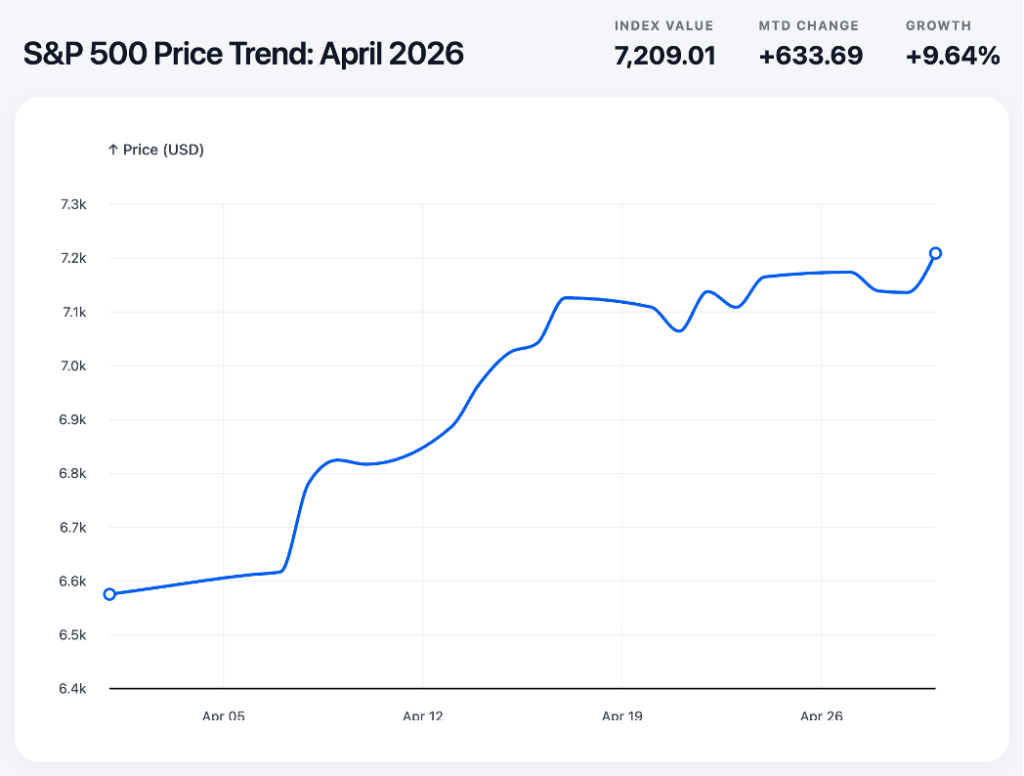
Source: Based on Data from Yahoo Finance
The US market opened April around 6,575 points and ground steadily higher from the first week, never really looking back. The engine behind the rally was not diplomacy or oil prices but corporate earnings. Nearly nine out of ten S&P 500 companies that had already reported first-quarter 2026 results beat analyst expectations, putting the index on track for earnings growth of 13% year-on-year, according to FactSet. Alphabet reported a first-quarter revenue beat and raised its full-year 2026 capital expenditure guidance to US$180–190 billion, exemplifying the strength of the AI-driven spending boom.
When Iran briefly announced the Strait of Hormuz was reopening on 17 April, the S&P 500 crossed 7,000 points for the first time in its history. Seven separate record closing highs were set during the month. Even the Fed's decision to hold rates steady and the late-month return of Strait of Hormuz tensions could only clip the index's wings briefly. The S&P 500 closed April at 7,209, up more than 9% for the month.
Why Such Different Outcomes?
The contrast comes down to how each market is built, and the two indices are structured in fundamentally different ways.
The S&P 500 is heavily weighted towards technology and communications companies, many of which sit at the centre of the global AI spending boom. These businesses report rising profits regardless of what oil prices are doing, because their cost bases are largely insulated from energy. When Alphabet raises its annual capital expenditure guidance to US$190 billion and still beats revenue expectations, that sends a powerful signal to investors that the underlying growth story is intact. Multiply that kind of earnings strength across dozens of large US companies, and you have an index that can absorb a great deal of geopolitical noise without losing momentum.
The ASX 200 is built very differently. Its two largest sectors are financials and materials, meaning the index's fortunes are closely tied to the health of Australian banks and the global appetite for commodities like iron ore and copper. Mining companies did benefit from firm commodity prices through parts of April, but they are inherently sensitive to the global growth outlook. If the Iran conflict drags on and the world economy slows, demand for steel and industrial metals softens, and mining valuations follow. Energy stocks faced an even more awkward situation: high oil prices would normally boost producers, but the sheer uncertainty around how long the conflict would last made investors reluctant to hold those positions with any conviction.
Australian banks, meanwhile, were contending with a domestic environment that offered little comfort. The RBA remained on hold, cost-of-living pressures were squeezing household budgets, and elevated fuel prices were feeding quietly into broader inflation. None of that is a recipe for strong bank earnings growth.
There is also the matter of investor psychology. US markets in April appeared to adopt a collective "look through" mentality, pricing in an eventual resolution to the conflict and anchoring on corporate earnings as the primary driver of value. Australian investors, lacking that same earnings tailwind and more exposed to commodity and energy volatility, were less willing to make that leap. Every ceasefire rumour moved the ASX sharply in one direction; every reversal moved it back. Without a strong domestic earnings story to provide ballast, the local market simply had less to stand on.
The IMF cut its 2026 global growth forecast to 3.1% in April, citing the energy shock from the conflict, with headline global inflation revised up to 4.4% for the year. That kind of downgrade matters more to a commodity-heavy market like Australia's than it does to a technology-driven one like America's. April 2026 was a vivid illustration of that structural gap, and a useful reminder that when Wall Street hits record highs, it does not automatically follow that Martin Place does too.
The Residential Property Market
If you have been spending your Saturday mornings shuffling through open homes with a coffee in hand, you might have noticed a subtle change in the air lately. The frenetic energy that defined much of last year seems to be settling down into a more measured rhythm. The property market is shifting, and the numbers from April 2026 confirm what many of us are feeling on the ground.
Following a highly eventful first quarter for the Australian property sector, April brought a noticeable cooling trend. To properly analyse this shift, we must look directly at the figures.
The National Overview: A Change of Pace
As we moved through April 2026, the national home value index rose by just 0.3%, according to Cotality data reported by Trading Economics. This marks the weakest growth we have seen in nearly a year.
While a national increase of 0.3% keeps the overall market in positive territory, this headline figure masks an increasingly diverse set of outcomes from city to city. We are looking at a multi-speed environment where your location dictates everything. Furthermore, this softer trend coincides with a complex economic backdrop. Buyer confidence is being dampened not just by sustained higher borrowing costs and cost of living pressures, but also by broader geopolitical uncertainties, particularly the ongoing Middle East conflict as noted by Trading Economics.
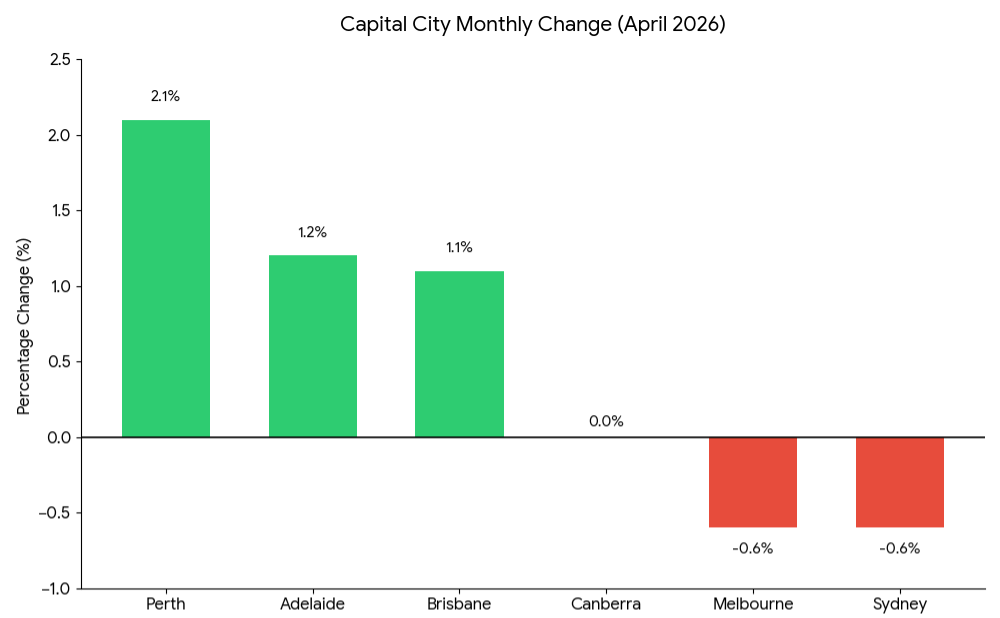
The Largest Capitals Retreat
At one end of the spectrum, our largest capital cities are experiencing a subtle decline. Throughout April 2026, dwelling values in both Sydney and Melbourne retreated by 0.6%, according to the latest Cotality index figures published by the Australian Property Update.
We are also seeing a noticeable increase in advertised supply in these specific regions. For instance, listings in Sydney are now sitting 9.4% above their five-year average. This extra stock is providing buyers with more choice and far less urgency at the negotiation table. This shift in buyer sentiment is reflected in falling auction clearance rates, which Cotality data notes have held consistently below 55% since late March. The pressure of higher borrowing costs is certainly making buyers more cautious and price-sensitive in these traditionally expensive markets.
Mid-Sized Capitals Keep Pushing
Conversely, the mid-sized capitals are continuing to defy the broader slowdown seen on the eastern seaboard. Perth remains the absolute standout performer. Housing values across the western capital jumped by 2.1% in April alone, based on Cotality reporting.
Brisbane and Adelaide are also holding incredibly strong. Brisbane gained 1.1% over the month, while Adelaide grew by 1.2%. These markets are being supported by relatively low inventory levels and ongoing interstate migration, proving that relative affordability and lifestyle factors remain highly attractive to Australian buyers willing to relocate for better value.
Houses Versus Units
Another interesting trend to emerge in April 2026 is the growing divide between detached houses and apartments. As borrowing capacities become stretched by economic pressures, buyer demand is noticeably shifting towards more affordable housing options.
In Melbourne specifically, Cotality figures show house values dipped 0.8% to a median of $972,734, while apartments eased by only 0.1% to $641,690. This suggests that even in a broadly cooling market, the lower end of the pricing spectrum is maintaining solid competition as buyers compromise on space to stay within their approved budgets.
The Rental Market Remains Tight
For property investors and tenants, the April update offers a stark reminder of Australia's ongoing housing supply issues. The rental market remains exceptionally competitive. This tight supply means rents are continuing their upward trajectory, with the Australian Property Update confirming that national vacancy rates are holding at a low 1.6%. Darwin is leading the charge in annual rental increases, while markets like Adelaide, Canberra, and Melbourne are experiencing more moderate but steady gains.
Capital City Performance
Below is a snapshot of how the major markets performed up to the end of April 2026, based on Cotality data synthesised by the Australian Property Update:
Looking Ahead
So, what does this mean as we head further into the middle of 2026? The data presents a fragmented picture rather than a unified national trend. The days of broad, rapid growth across all states appear to be pausing. Instead, we are seeing a market defined by local dynamics. In the larger capitals, the current environment demands a careful approach, as buyers take their time to weigh their options and sellers adjust to a calmer reality. Meanwhile, those looking to purchase in the mid-sized capitals will likely continue to face stiff competition.
Inflation and Interest Rates
If you have filled up your car recently, you might have noticed the numbers on the petrol pump spinning much faster than usual. It is a feeling many of us share, watching our hard-earned dollars stretch a little less each week. This morning, that pinch became a bit more official. Today, 5 May 2026, the Reserve Bank of Australia (RBA) announced another increase to the official cash rate. Let us examine what this means for your family budget and the broader Australian economy.
In their latest media release (Reserve Bank of Australia, 2026), the RBA Board confirmed an increase of the cash rate target by 25 basis points. This move pushes the official interest rate up to 4.35 per cent. The decision was not unanimous, but a clear majority of eight members voted for the increase, while one member preferred to hold the rate steady at 4.10 per cent.
To understand why borrowing costs are climbing, we must look at the primary driver of this decision: inflation. In basic terms, inflation measures the rate at which the general prices of goods and services are rising across the country. The RBA aims to keep this rate low and stable, but recent global and local events have made this quite difficult.
According to the Reserve Bank of Australia (2026), several distinct factors influenced today's announcement:
- Rising Fuel Prices: Ongoing conflict in the Middle East has sharply increased global fuel and commodity costs. These expenses quickly trickle down to local transport and logistics, forcing Australian businesses to raise their prices.
- Capacity Pressures: The Australian economy experienced higher-than-expected capacity limits towards the end of 2025. This means the demand for goods and services outpaced what businesses could supply efficiently, naturally pushing prices upwards.
- Business Costs: There are clear early signs that local firms are passing their increased operational costs directly to consumers. Short-term measures of inflation expectations have also risen, which further accelerates the problem.
The RBA also noted that while financial conditions have tightened this year, credit remains readily available to both households and businesses, meaning the economy still has momentum that needs to be cooled down.
If you hold a variable-rate mortgage, you should prepare for higher monthly repayments. Banks and lenders typically pass these cash rate increases directly to their customers within weeks. On the flip side, if you rely on savings, you might see a slight increase in the interest paid on your bank balances.
The primary goal of raising interest rates is to slow down overall spending. By making it more expensive to borrow money, the RBA hopes we will all spend a little less, which theoretically encourages businesses to stop raising prices. It is a difficult but important balancing act between taming inflation and keeping the economy healthy. The economic outlook remains uncertain. While the RBA hopes easing global tensions will stabilise fuel prices and lower inflation, the RBA warns that prolonged overseas conflicts could push energy costs higher and trigger further rate hikes. Although these immediate increases are frustrating, the ultimate goal is a stable economy where everyday prices stop climbing so rapidly. For now, managing these changes requires patience and careful household budgeting.