The Share Market
February 2026 provided a masterclass in market dynamics, showcasing a remarkable divergence between Australian and United States equities. As we examine the performance of the S&P/ASX 200 and the S&P 500 based on the provided graphs, we see two entirely different economic stories unfolding in real time. One market enjoyed a record-breaking surge fuelled by traditional economic pillars and a phenomenal earnings season, while the other experienced a volatile reality check as investors reassessed the immediate, tangible impacts of artificial intelligence. If you were monitoring your portfolio last month, you likely felt that familiar tension as standard index tracking failed to tell the whole story. Let’s explore the specific movements and the underlying global events that shaped this fascinating month.
The ASX 200's Relentless Climb to Record Highs
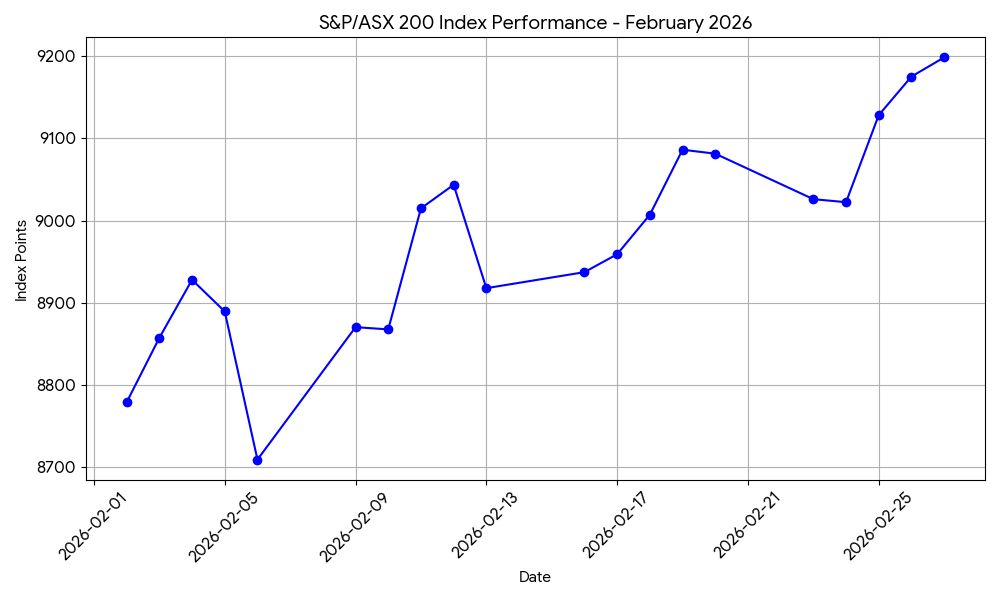
Source: Based on Data from Google Finance
Looking at the first graph above, the S&P/ASX 200 presents a picture of robust and sustained growth, despite a slightly rocky start. The index began February near 8,780 points. Following a sharp, sentiment-driven dip around the 5th of February that pushed the market down to the 8,710 mark, it commenced a relentless upward climb. This trajectory culminated in a record-high finish near 9,200 points, representing a stellar 3.7 percent gain for the month. This exceptional performance was not an accident; it was the direct result of a remarkably strong local reporting season. According to market reporting from IG Australia, heavyweight miners, banks, and consumer staples delivered highly resilient results that aggressively boosted the aggregate index.
The true engines of this growth were familiar household names that proved the enduring value of traditional business models. The Commonwealth Bank of Australia raced 17 percent higher following a highly impressive half-year result that featured a 6 percent increase in cash net profit and a lifted interim dividend. Similarly, BHP Group surged 15.5 percent on the back of record copper earnings and a massive streaming agreement. We also saw incredible momentum in the materials sector, with companies like Lynas Rare Earths rocketing 27 percent. However, it was not an entirely smooth ride for all constituents. As detailed by The Motley Fool Australia, the healthcare and technology sectors faced specific headwinds. CSL crashed nearly 20 percent following soft results and the sudden resignation of its Chief Executive Officer, while Pro Medicus tumbled 29 percent after posting results that were softer than the market's high expectations.
Beyond domestic earnings, international geopolitics provided an unexpected but highly lucrative tailwind in the final week of February. The sharp rise seen on the graph between the 24th and 28th of February aligns perfectly with the United States Supreme Court striking down the previous administration's International Emergency Economic Powers Act tariffs. As market analysts noted in late February (IG Australia), replacing these with a flat global tariff effectively reduced the net tariff burden on China. This suddenly improved the global economic outlook and sparked a massive late-month rally in Australian materials and lithium stocks, ultimately pushing the ASX 200 to its record close.
The S&P 500's Technological Reality Check
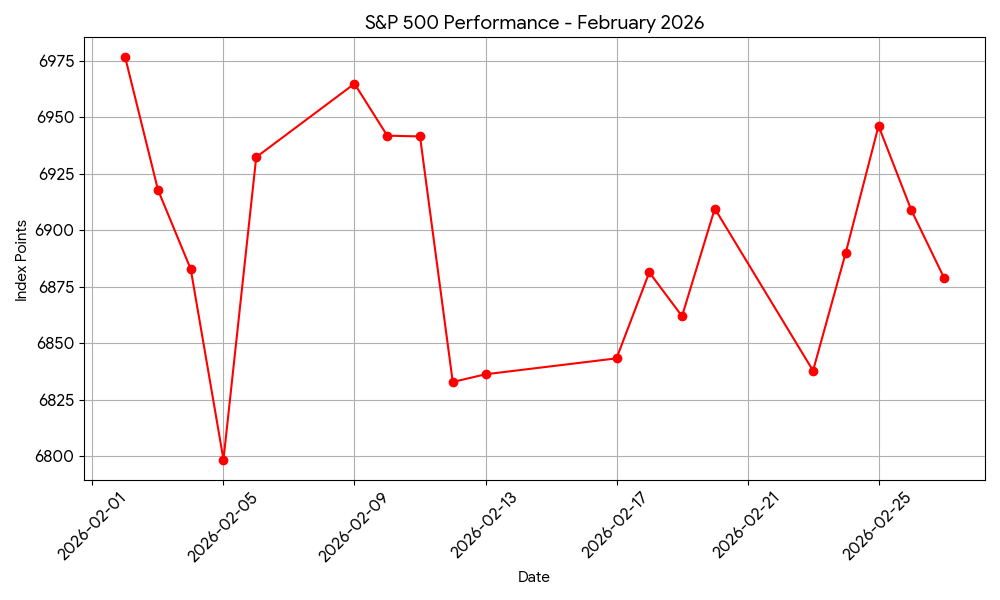
Source: Based on Data from Google Finance
Turning our attention to the second graph above, the S&P 500 illustrates a decidedly more turbulent and ultimately suppressed story. Starting the month on a high near 6,975 points, the index suffered a violent plunge on the 5th of February, bottoming out around 6,798 points. While it attempted several recoveries throughout the month, specifically peaking around the 9th and spiking again on the 25th, it consistently met heavy resistance and finished February lower at approximately 6,878 points. This represents an overall decline of roughly 0.8 percent, a stark contrast to the Australian market's resounding success.
The massive drop on the 5th of February was a defining moment for American equities. It coincided with a severe deleveraging event in the cryptocurrency space, which spilled over into broader market sentiment and forced institutional investors to reduce their risk exposure. However, the more persistent drag on the index throughout the rest of the month was a fundamental shift in how Wall Street views the integration of artificial intelligence. The Financial Times highlights that the market narrative began to pivot from viewing AI as a speculative growth engine to fearing it as a source of immediate industry disruption. This anxiety was particularly acute following the release of advanced AI tools like Anthropic’s "Claude Code," which demonstrated the ability to automate complex programming tasks. These developments led investors to worry that AI could rapidly erode the pricing power and operational moats of established software and technology service companies.
This psychological shift triggered a significant sell-off in the mega-cap technology stocks that heavily weight the S&P 500. Even companies reporting fundamentally excellent results were not immune to this broader thematic fear. NVIDIA beat its earnings forecasts, yet its shares fell 5.5 percent as the results failed to sustain the previously insatiable market momentum. Software giants like Adobe and Salesforce, alongside financial data providers, faced severe downward pressure. The cap-weighted nature of the S&P 500 meant that as these massive technology companies stumbled, they dragged the entire headline index down with them, perfectly reflecting the volatile trajectory shown in the second graph.
Comparing the Two Markets
When we compare and contrast these two markets, the most vital takeaway from February 2026 is the aggressive return of sector rotation and the temporary triumph of value over growth. The S&P/ASX 200 is fundamentally heavily weighted towards financials and materials. These are traditional, tangible sectors that benefit from solid operational earnings, high dividend yields, and global economic resilience. When global investors sought safety and reliable cash flows amidst the American tech volatility, the Australian market was perfectly positioned to capture that institutional capital.
Conversely, the S&P 500's slight decline masks an incredible development beneath the surface. While the headline index fell due to its heavy technology concentration, the average United States stock actually performed exceptionally well. As reported by Defiant Capital Group, the equal-weighted S&P 500 gained 3.5 percent during February. Investors were not fleeing the American market entirely; they were simply taking their profits out of crowded, expensive tech trades and reallocating them into utilities, consumer defensives, and industrials. If your portfolio was diversified beyond a handful of mega-cap technology names, February was likely a highly successful month, despite what the headline American index might suggest on the evening news.
This divergence serves as a potent reminder that understanding the underlying composition of an index is just as important as tracking its daily graphical movements. The Australian market demonstrated the enduring power of traditional value and strong operational earnings, while the American market highlighted the severe risks of extreme sector concentration during periods of rapid technological transition.
The Residential Property Market
It has been an intriguing start to the year for the Australian property sector. As we settled into February, we were speaking with a friend who recently sold their home in Perth, completely astounded by the sheer volume of interested buyers at their first open inspection. This perfectly captures the current energy in certain parts of the country. Despite the ongoing pressures of living costs and the recent February interest rate hike, home values in several key markets have continued to climb upwards.
Here is a look at how the market performed throughout February 2026 based on Cotality’s Home Value Index and what we might expect as the year progresses.
A Divided Market in February
The Australian housing market has shown a clear split in performance two months into 2026. National home values grew by 0.8% in February, pushing the national median dwelling value to $922,838. While the national figure shows growth, the results across our capital cities were quite varied.
Our two largest markets, Sydney and Melbourne, both recorded flat growth of 0.0% over the month. This levelling off suggests that the February interest rate increase and a general drop in consumer sentiment are starting to take their toll on these higher-priced cities.
Conversely, mid-sized capitals and regional markets proved much more robust. Combined regional areas saw a solid 1.1% increase in February. Perth was the absolute standout, recording a massive 22.0% annual jump and adding more than $22,500 to its median dwelling value in just one month.
| Market | Annual change Jan 2026 | Annual change Feb 2026 | Median value Jan 2026 | Median value Feb 2026 |
| Sydney | 6.4% | 6.0% | $1,290,537 | $1,296,039 |
| Melbourne | 5.4% | 4.7% | $830,371 | $826,132 |
| Brisbane | 15.7% | 17.3% | $1,054,555 | $1,080,538 |
| Adelaide | 9.7% | 10.9% | $914,203 | $922,991 |
| Perth | 18.5% | 22.0% | $961,898 | $989,211 |
| Hobart | 7.0% | 7.7% | $722,339 | $728,815 |
| Darwin | 19.7% | 19.4% | $602,870 | $602,284 |
| Canberra | 5.5% | 6.2% | $884,844 | $903,374 |
| National | 9.4% | 9.9% | $912,465 | $922,838 |
Source: Cotality’s Home Value Index
A Shift in Momentum
As we moved through February, the "two-speed" nature of the market became incredibly apparent. While the mid-sized capitals surged ahead, the heavyweights took a breather. The monthly pace varied significantly across the country:
- Perth remained the strongest performer with a 2.3% monthly gain.
- Brisbane and Adelaide followed with solid growth of 1.6% and 1.3% respectively.
- Sydney and Melbourne stalled, showing 0.0% growth for the month.
While the flatline in Sydney and Melbourne suggests some cooling, experts note that demand is simply shifting toward more affordable properties. For instance, house values at the lower end of the Sydney market rose by 0.8% in February, while the upper quartile of the market actually dropped by 0.9%. First home buyers and investors are actively competing in this lower-priced sector, while higher price points face tighter credit access.
The Rental Crunch
For renters, the picture is a bit of a mixed bag. The annual change in rents has accelerated across most capitals, although there are a few exceptions. Interestingly, rental growth across Adelaide has eased slightly, dropping to an annual rate of 3.2%. Perth has also seen a minor easing in its annual rental growth rate compared to the same time last year.
Why Prices Keep Rising
You might wonder why prices in places like Perth and Brisbane are still going up so rapidly. The simple answer is a severe lack of supply. In the four weeks leading up to 22 February, the number of homes advertised for sale in Perth was 48% below the five-year average. Brisbane and Adelaide were also severely undersupplied, sitting 31% and 23% lower than average.
When there are not enough homes for sale, buyer demand easily keeps prices moving upward. Meanwhile, we are seeing the opposite effect in Sydney and Melbourne, where fresh listings have actually picked up. In Sydney, freshly advertised stock was 9.7% above the five-year average, which has helped to stabilise price growth in that city.
What’s Next?
The recent February rate hike has definitely eroded borrowing power, and affordability remains a significant hurdle for many buyers. However, strong labour market conditions and high employment levels continue to provide a safety net, reducing the likelihood of forced selling. Furthermore, government initiatives like the 5% deposit guarantee are still supporting first home buyers.
While the extreme shortage of housing should prevent any drastic price falls in the near future, we expect growth to be modest and increasingly uneven. The balance of affordability and access to credit will be the main factors shaping the Australian property market in the months ahead.
Inflation and Interest Rates
If you noticed your latest electricity bill was significantly higher or your mortgage repayment increased, you are experiencing the reality of Australia’s current economic climate. February 2026 was a demanding month for households as inflation remained stubborn and the Reserve Bank of Australia (RBA) resumed its cycle of interest rate increases.
The RBA Returns to Rate Hikes
On 3 February 2026, the RBA Board raised the cash rate target by 25 basis points to 3.85 per cent. This decision ended a period of stability, with the Board noting that price pressures had strengthened unexpectedly toward the end of 2025.
For a family with a $600,000 variable mortgage, this increase adds approximately $100 to monthly repayments. The RBA stated this move was a necessary step to prevent high inflation from becoming a permanent fixture in the economy. You can review the full reasoning in the RBA Monetary Policy Decision for February 2026.
Why is Inflation So Persistent?
Data released by the Australian Bureau of Statistics (ABS) on 25 February showed that the Monthly Consumer Price Index (CPI) indicator remained at 3.8 per cent for the year to January 2026. This is still well above the RBA’s preferred target of 2 to 3 per cent.
Several specific areas drove these figures:
- Electricity (+32.2 per cent): The end of government energy rebates caused a massive spike in utility costs for most households.
- Housing (+6.8 per cent): Rental shortages and high construction costs continue to make housing the largest contributor to inflation.
- Food (+3.1 per cent): While grocery prices are rising more slowly than in previous years, they still place a constant strain on weekly budgets.
Full details are available via the ABS Consumer Price Index, January 2026 report.
The Road Ahead
The RBA’s February Statement on Monetary Policy suggests that the path to lower prices will be longer than initially hoped. The bank now expects headline inflation to peak at 4.2 per cent by mid-2026.
This means that interest rates are likely to stay "higher for longer." While this is difficult for borrowers, the goal is to cool the economy enough to bring prices back under control by 2028. Further analysis of these projections can be found in the RBA Statement on Monetary Policy – February 2026. Ultimately, February 2026 has shown that the Australian economy is in a transition phase. While the job market remains relatively strong, the cost of living continues to be the primary challenge for most Australians.