The Share Market
Welcome back to our first monthly market wrap of 2026. It is wonderful to have you with us as we unpack a rather turbulent start to the year. January is usually a month of setting intentions, but for the financial markets, it was a month of intense "reality checks" and record-breaking shifts. While many expected a quiet return to business, we instead saw a "January surprise" that kept both local and global investors on their toes.
The ASX 200: A Record-Breaking Run Met with Rate Jitters
Based on the graph below from Google Finance, the S&P/ASX 200 began the year with a quiet sense of optimism, trading around the 8,730 mark. The early days of the month saw some modest consolidation as investors processed the final data from the previous year. However, as we moved into the second week of January, the market began a steady climb, underpinned by a massive surge in the materials sector. This was primarily driven by what analysts are calling a "commodity supercycle" revival, with companies like BHP and Rio Tinto reaching all-time highs due to surging global demand for copper and lithium.
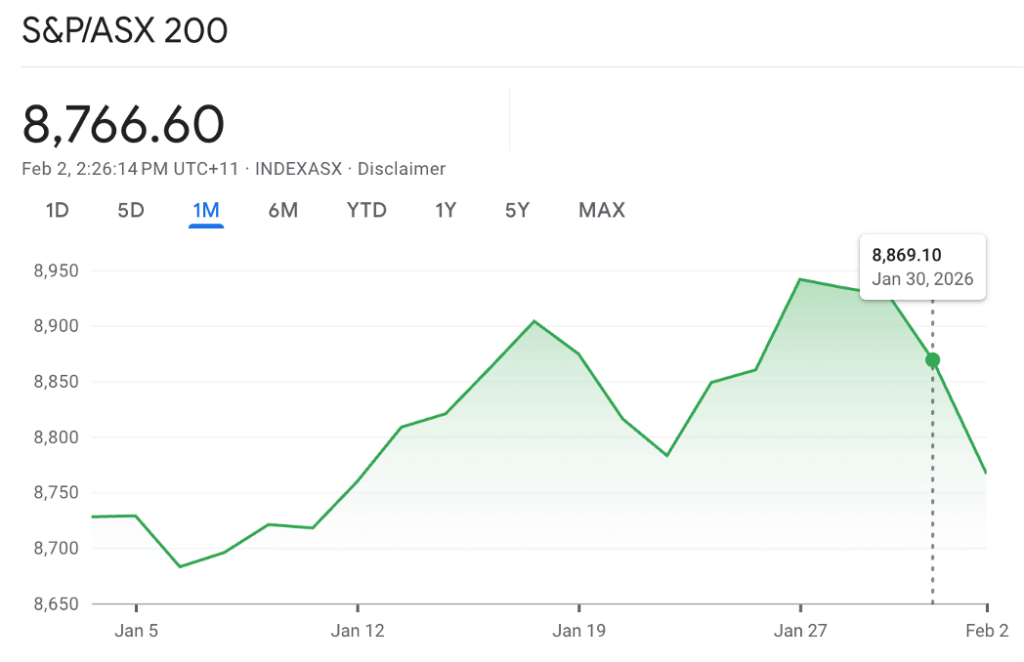
Source: Google Finance
The graph shows a notable "monster" rally beginning around 12 January, which pushed the index toward the 8,850 level. This upward momentum was briefly challenged on 22 January. On that day, the Australian Bureau of Statistics released a labour force report that completely blindsided the market. Employment surged by 65,000, far exceeding the expected 30,000 gain, while the unemployment rate fell to 4.1%. While a strong job market is generally good news, it immediately heightened fears that the Reserve Bank of Australia (RBA) would need to hike interest rates to cool the economy. The market-implied probability of a rate hike at the 3 February board meeting jumped to 60% almost instantly.
Despite these hawkish signals, the ASX 200 showed remarkable resilience. As the graph indicates, the index didn't just hold its ground; it surged to a peak of 8,869.10 on 30 January, finishing the month with a solid 1.78% gain. This peak was largely the result of a spectacular run in gold and uranium stocks, which acted as a hedge against rising geopolitical tensions. Gold prices soared above $5,000 per ounce for the first time, providing a massive tailwind for local miners like Northern Star Resources and Evolution Mining. However, the month ended on a more sombre note. A sharp pullback in the final sessions of January, visible in the steep decline on the far right of the graph, occurred as traders locked in gains and prepared for the RBA's decision in early February.
The S&P 500: Tech Resilience and Political Shocks
The S&P 500 tells a different story of resilience, finishing the month up 1.17% at 6,939.03. The US market got off to a flying start, reaching fresh record highs in the first two weeks of trading. Much of this was powered by a "maturing" AI rally. Unlike the speculative frenzy of previous years, investors in 2026 are rewarding companies with clear earnings growth. A standout moment occurred on 12 January, when Alphabet reached a valuation of $4 trillion for the first time following news that Apple would use its Gemini AI model.
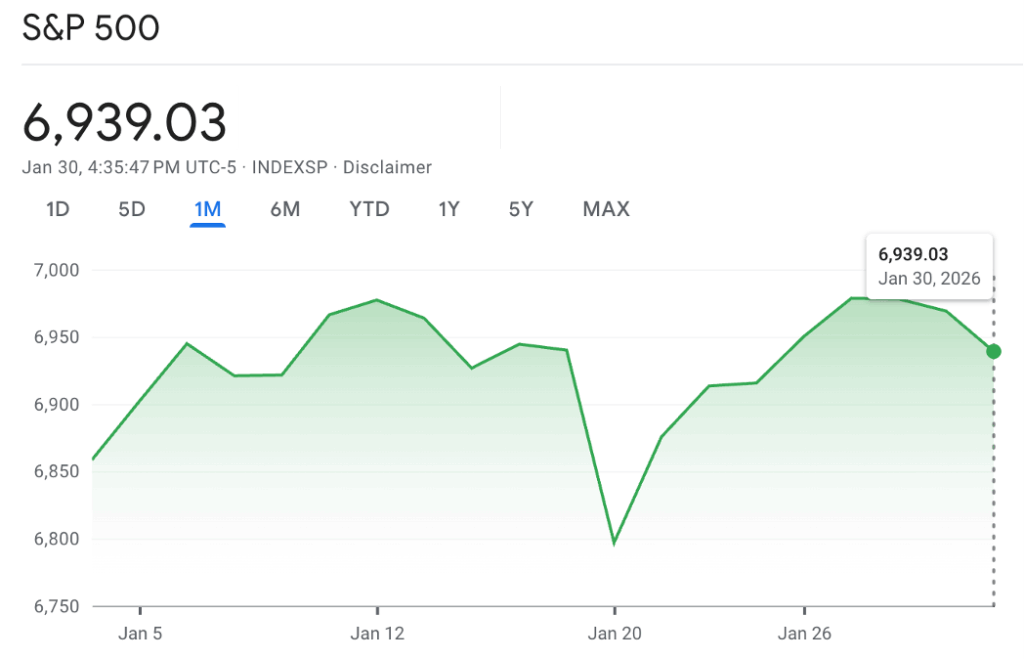
Source: Google Finance
However, the S&P 500 graph reveals a sharp and dramatic "V-shaped" dip around 20 January. This volatility was sparked by a combination of global events, including renewed trade tariff threats and a spike in geopolitical tensions following reports of potential US military action in the Middle East. For a moment, it appeared that the "US exceptionalism" that had driven markets for years was under threat. Safe-haven demand surged, causing gold to skyrocket while traditional equities were sold off.
The recovery seen in the latter half of the month was supported by a "strategic pause" from the Federal Reserve. During the 28 January meeting, Chair Jerome Powell announced that the Fed would hold the target interest rate steady at 3.50% to 3.75%. This decision, which followed three consecutive rate cuts in late 2025, provided a much-needed sense of stability to the US market. The graph shows the index climbing back toward its previous highs following this announcement. However, the month ended with a final burst of volatility on 30 January after the nomination of Kevin Warsh to succeed Jerome Powell as Fed Chair. This news caused a sharp rise in the US dollar and a "flash crash" in precious metals, which trickled through to equity valuations and caused the slight downward tick at the end of the January 30 trading session.
Comparing the Two Markets: A Divergent Start to 2026
When we compare and contrast the two markets, it is clear that they were driven by very different underlying forces in January. The Australian market remains heavily influenced by the "physical" economy, with the ASX 200 recording a 1.78% gain to close the month at 8,869.10. Our gains were almost entirely dependent on the strength of our miners and the surging price of commodities like gold, copper, and iron ore. While the index hit a record intraday peak of 8,978.50 on 30 January, it faced a sharp late-session pullback as the "resource-led" record was met with caution over domestic economic data. Consequently, the local market remains much more sensitive to domestic employment figures and the sudden resurgence of inflationary pressures than its global counterparts.
In contrast, the US market continues to be a "productivity and policy" story, with the S&P 500 finishing January up 1.17% at 6,939.03. While the US index also benefited from the global surge in materials, its core strength lies in technology and large-cap earnings, particularly as AI narratives move into a more mature, revenue-focused phase. The US market was notably more reactive to political developments—such as the nomination of Kevin Warsh to lead the Federal Reserve and shifting trade policy—than the Australian market. Furthermore, a significant policy divergence has emerged; while the US Fed maintains a neutral holding pattern, the RBA has acted decisively on "sticky" 3.8% inflation by hiking the cash rate to 3.85% on 3 February.
Overall, January 2026 has been a month of transition characterised by a global rotation away from pure "growth" and toward "value" and "hard assets". If your portfolio is diversified across both the ASX 200 and the S&P 500, you likely benefited from the mining strength in Australia while enjoying the steady earnings growth of US tech giants. However, the month ended with a "deleveraging" event that saw both indices retreat from their mid-month peaks. As we move into February, the focus has shifted from the optimism of the New Year to the practicalities of a "higher for longer" interest rate environment and the impact of the RBA's first hike in over two years.
The Residential Property Market
It has been a fascinating start to 2026 for the Australian property market. As we moved through the festive season and into the first month of the year, the housing sector showed a surprising level of resilience. Despite the squeeze on our wallets from the cost of living and the looming shadow of interest rate hikes, home values have continued to climb.
Here is a look at how the market performed over the turn of the year based on Cotality’s Home Value Index and what we might expect as we head further into 2026.
A Strong Finish to 2025
The Australian housing market ended 2025 on a high note, even if things cooled slightly in the final month. Over the 2025 calendar year, national home values surged by 8.6%, which added roughly $71,400 to the median value of an Australian home. This was the strongest yearly gain since the post-pandemic boom in 2021.
In December 2025, the national Home Value Index (HVI) recorded a 0.7% increase. However, the results across our capital cities were quite mixed. While most cities saw gains, our two largest markets — Sydney and Melbourne — both dipped by 0.1%. This was the first monthly fall for these cities since early 2024, signaling that high prices and interest rate jitters were starting to take their toll.
Regional markets proved more robust at year's end, with values rising 1.0% in December. Across the entire year, regional areas grew by 9.7%, outpacing the 8.2% rise seen in the combined capital cities. Western Australia and regional Queensland were the standouts, with WA leading the way with a massive 16.1% annual jump.
| Market | Annual change Dec 2025 | Annual change Jan 2026 | Median value Dec 2025 | Median value Jan 2026 |
| Sydney | 5.8% | 6.4% | $1,280,613 | $1,290,537 |
| Melbourne | 4.8% | 5.4% | $827,117 | $830,371 |
| Brisbane | 14.5% | 15.7% | $1,036,323 | $1,054,555 |
| Adelaide | 8.8% | 9.7% | $902,249 | $914,203 |
| Perth | 15.9% | 18.5% | $940,635 | $961,898 |
| Hobart | 6.8% | 7.0% | $720,341 | $722,339 |
| Darwin | 18.9% | 19.7% | $586,912 | $602,870 |
| Canberra | 4.9% | 5.5% | $893,907 | $884,844 |
| National | 8.6% | 9.4% | $901,257 | $912,465 |
Source: Cotality’s Home Value Index
A Subtle Acceleration in January 2026
As we rang in 2026, the market didn't just hold steady, it actually picked up a bit of speed. National home values rose by 0.8% in January, a slight increase from the 0.6% growth seen in December. The national median dwelling value now sits at $912,465.
What is particularly interesting is the "two-speed" nature of the market. While every capital city recorded an increase in January, the pace varied significantly:
- Perth remained the strongest performer with a 2.0% monthly gain, although this is down from its recent peaks.
- Brisbane and Adelaide followed with solid growth of 1.6% and 1.2% respectively.
- Sydney and Melbourne saw a marginal recovery, rising by 0.2% and 0.1%.
While these small gains in Sydney and Melbourne suggest some stability, values in both cities remain below their previous record highs. Experts suggest we're seeing a trend where demand is shifting toward more affordable areas. For instance, house values at the lower end of the market rose by 1.3% in January, far outstripping the 0.3% growth seen in more expensive properties.
The Rental Crunch and Yields
For renters, the start of the year hasn't brought much relief. The national vacancy rate rose slightly to 1.7% in January, but this is still incredibly tight compared to the long-term average. Adelaide currently has the toughest rental market in the country, with a vacancy rate of just 1.0%.
Rents across Australia rose by 0.6% in January, the fastest monthly jump since last April. Over the past year, rents have increased by 5.4%, which has added about $35 a week to the average median rent. Interestingly, Darwin and Hobart have seen the strongest rental growth lately, with Darwin's unit rents jumping 8.2% over the last 12 months.
Because home values are rising faster than rents, we’re seeing "gross rental yields" drop to 3.56% nationally—the lowest level we've seen since late 2022. Despite this, investors remain very active, making up about 41% of all new mortgage demand.
Why Prices Keep Rising
You might wonder why prices are still going up when it feels like everything is getting more expensive. The simple answer is a lack of supply. In January, the number of homes advertised for sale was 19% lower than the same time last year and a staggering 25% below the five-year average.
When there aren't enough homes for sale, even modest buyer demand is enough to keep prices moving upward. We are also seeing first-home buyers and investors competing for a limited pool of more affordable houses, which is driving the growth we're seeing in outer suburbs.
What’s Next?
The rate rise announced by the RBA on 3 February is likely to dent buyer confidence and reduce how much people can borrow. While the chronic shortage of housing should prevent prices from falling significantly, we expect the pace of growth to slow down as the year progresses.
For now, the Australian property market remains remarkably resilient, but the balance of affordability and rising rates will be the key story to watch in the coming months.
Inflation and Interest Rates
While the first few weeks of the year felt like a fresh start, the final days of the month have provided a significant reality check for the Australian economy.
The "quiet" start to 2026 has been replaced by a renewed focus on the cost of living. Based on the latest data from the Australian Bureau of Statistics and the Reserve Bank of Australia (RBA), here’s what you need to know about the recent shifts in inflation and interest rates.
The Inflation Rebound
The most significant news arrived on 28 January with the release of the December 2025 Consumer Price Index (CPI). After showing signs of cooling late last year, headline inflation jumped to 3.8%, up from 3.4% in November.
This rebound was largely driven by specific areas hitting household budgets. Electricity prices saw a massive 21.5% surge as various state government subsidies and rebates expired. Beyond power bills, services inflation — which covers rents, insurance, and travel — hit a two-year high of 4.1%. Rents rose by 3.9% over the year, while domestic travel costs jumped by 9.6%. The RBA’s preferred "trimmed mean" inflation also ticked higher to 3.3%, suggesting that price pressures are becoming broad-based rather than limited to a few volatile items.
The RBA’s Response
Following this hotter-than-expected data, the Reserve Bank Board met for the first time this year on 3 February. In a move that was increasingly priced in by markets, the RBA increased the cash rate by 25 basis points to 3.85%.
This is the first rate rise since late 2023. Governor Michele Bullock noted that while the economy has slowed, the persistence of services inflation required a firm response to ensure inflation returns to the 2–3% target range. For homeowners, this hike adds roughly $90 a month to repayments on a typical $600,000 mortgage.
What This Means for 2026
This shift directly impacts the themes we’ve discussed this month. While home values rose by 0.8% in January, momentum was already starting to leave the market in Sydney and Melbourne. With borrowing costs moving higher, we'll likely see a further cooling of housing demand as serviceability assessments become more difficult for prospective buyers.
In the share market, investors are already reacting. While the mining sector carried the ASX 200 to new highs in January, the banking sector faced a late-month pullback as traders weighed the impact of higher rates on mortgage growth.
As we move into February, the focus will stay on how households handle these renewed pressures. True financial resilience this year will come from staying ahead of these changes—reviewing your debt structures, auditing your cash flow, and ensuring your investment strategy accounts for a "higher for longer" interest rate environment. We’ll continue to monitor the data and bring you the most reliable updates as the year unfolds. Thank you for joining us for our January wrap, and we look forward to a productive February ahead.