
The Share Market
September has painted a contrasting picture for Australian and US stock markets, highlighting a growing divergence in central bank policy and economic sentiment. While a pivotal interest rate cut from the US Federal Reserve propelled Wall Street to new heights, the local ASX 200 has been more subdued. As we head into the final days of the month, the Australian market remains weighed down by uncertainty over a crucial domestic inflation report.
ASX 200
The ASX 200 has spent most of September trading in a volatile band between 8,750 and 8,950. The market's pattern has been one of brief rallies struggling to find momentum before pulling back, leaving the index below the record peaks seen in late August. As of the final week of the month, it's tracking a loss of around 2% month-to-date.
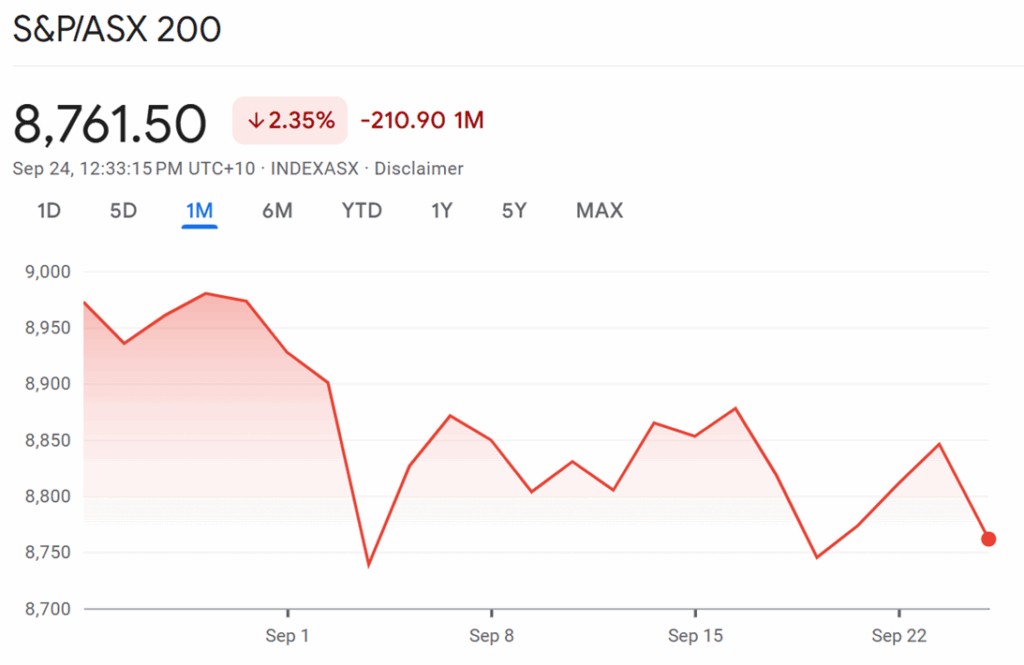
Source: Google Finance
The main factor casting a long shadow over local sentiment is the upcoming inflation data. The monthly CPI indicator for August, due from the ABS this week, has become the market's central focus. An unexpectedly high figure would confirm that inflation is sticky, could make the RBA more cautious about further easing. This uncertainty has particularly affected rate-sensitive sectors like property and consumer discretionary stocks.
Elsewhere, aftershocks from the August earnings season continue to be felt. Many companies that provided cautious outlooks have seen their share prices drift lower. The heavyweight mining sector has also faced headwinds from softening industrial data out of China. On a brighter note, gold producers have found support from a stronger bullion price, and the major banks, while cautious, have provided the market with some resilience during recent sessions.
S&P 500
In the US, the story has been far more positive and decisive. The S&P 500 has advanced strongly month-to-date, posting gains of around 3% and setting fresh record highs along the way.
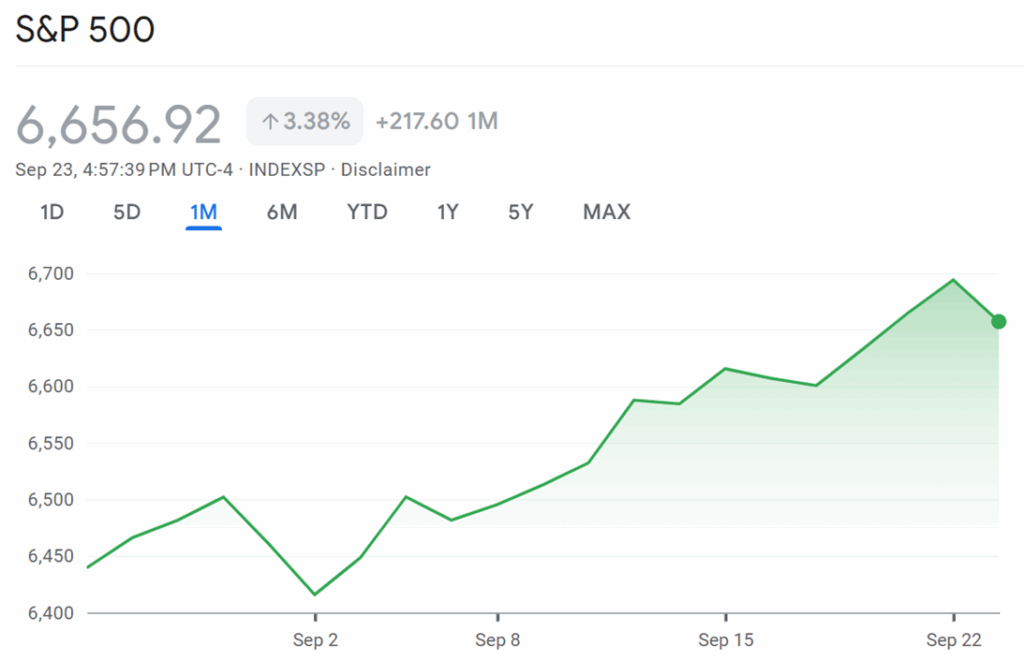
Source: Google Finance
The decisive catalyst was the Federal Reserve’s 25‑basis‑point cut on 17 September to a 4.00%–4.25% target range, the first reduction since December, with the policy statement and projections signalling potential for further easing into year‑end.
The decision followed an August CPI print at 2.9% year‑on‑year with core at 3.1%, a mix that kept inflation above target but, alongside softer labour indicators, justified a cautious start to the easing cycle rather than a larger 50‑basis‑point move.
Strategists lifted profit and index targets as mega‑cap earnings stayed firm and AI‑linked capital‑spending themes persisted, supporting risk appetite despite valuation debates.
US dailies around 23 September saw a modest tech‑led dip, but the pullback was framed within an up‑month backdrop and a market still near record territory after the Fed’s move and favourable guidance, leaving breadth and leadership intact.
Macro dashboards captured that September‑to‑date gains pushed the main US benchmark to a fresh all‑time high area during the month, reflecting both policy support and earnings momentum.
Put simply, the policy inflection and earnings revisions outweighed the usual “September effect” in the US this year.
Why the Two Markets Diverged
The difference in performance this month comes down to a few key points:
- Policy Clarity: The US market is enjoying a clear policy tailwind from a central bank that has actively started an easing cycle. In contrast, Australian investors are grappling with domestic headwinds and are still waiting for crucial data to get a sense of the RBA's next move.
- Economic Sensitivity: Australia’s market, with its heavy weighting towards cyclical sectors like mining, is more exposed to global growth concerns and economic signals from China. The US market's rally has been fuelled by a powerful domestic narrative around technology and earnings.
- Dominant Themes: The S&P 500 continues to be driven by the powerful AI investment theme, which has a less direct impact on the broader Australian market.
As September draws to a close, the local CPI release is the immediate hurdle for Australian portfolios. For the US, investors will be watching to see if the market can hold its gains and if corporate earnings can continue to justify the high valuations as we head into the final quarter of the year.
Outlook and Implications
Looking ahead, whether the ASX 200 recovers will hinge on domestic rate decisions and ongoing resource sector dynamics. The US market faces ongoing debate about valuations and sustainability of the rally, especially in technology. As investors weigh inflation, policy, and global supply chains, the contrasting fortunes of both indices in September will shape risk appetite as the year draws to a close.
The divergent performances in September highlight the importance of sector exposure, global event flow, and central bank action for index returns in developed markets.
The Residential Property Market
Data recently released from Cotality’s September 2025 Monthly Housing Chart Pack shows momentum firmed through August, with national dwelling values up 1.8% over the quarter and the annual pace lifting to 4.1% as the monthly index rose 0.7% in August. Across early September, the rolling 28‑day change in the combined capitals Daily Home Value Index was up 0.8%, with Brisbane, Perth and Adelaide leading and Melbourne lagging on a smaller gain.
Prices and Momentum
Quarterly growth of 1.8% to August marks the strongest three‑month rise since Q2 2024’s 2.0%, underscoring a steady upswing rather than a surge. Annual growth accelerated for a second month to 4.1%, rebounding from 3.6% across FY24/25 as momentum broadened beyond the most affordable quartile of capital‑city homes to the market’s middle segment. The combined capitals’ 28‑day trend to 9 September continued to lift, reflecting tight supply conditions into spring.
Capital City Leaders
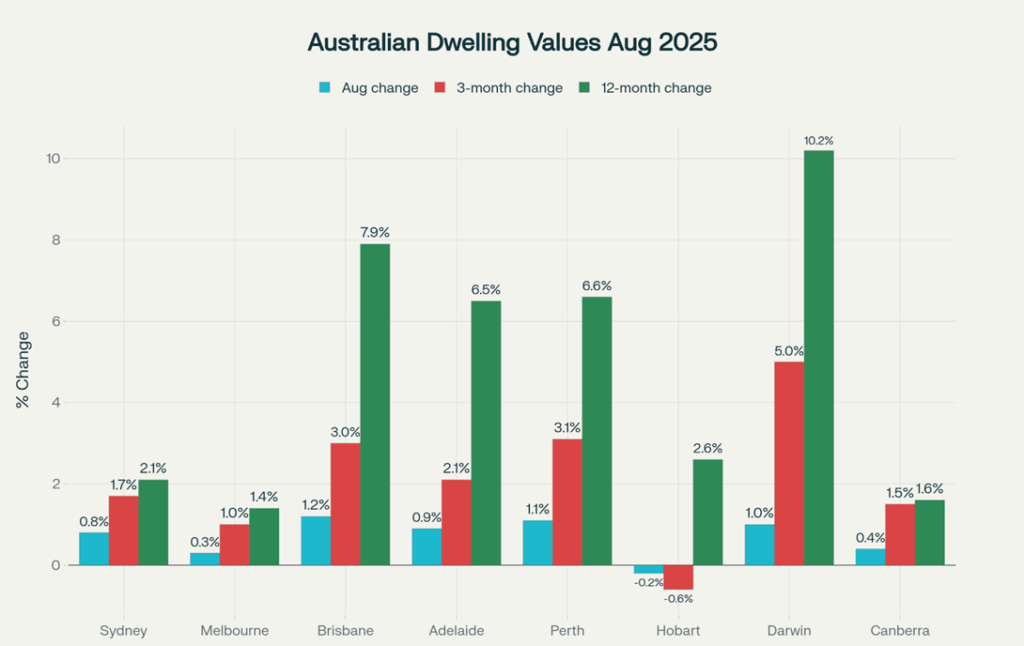
Source: Data from Cotality’s September 2025 Monthly Housing Chart Pack
The mid‑sized capitals dominated August, with Brisbane up 1.2%, Perth 1.1% and Adelaide 0.9%, while Sydney rose 0.8% and Melbourne 0.3%, and Hobart dipped 0.2%. On a quarterly view, Darwin led at 5.0% with annual growth of 10.2%, while Brisbane posted 3.0% for the quarter and 7.9% annually, confirming a broad‑based city upswing at differing speeds. Sydney values remain at record highs, while Melbourne values sit about 3% below their March 2022 peak despite seven straight months of gains into August.
Listings and Sales
Cotality estimates 43,436 sales nationally in August, taking the rolling 12‑month count to 538,329, which is 2.0% above a year earlier and 3.8% above the prior five‑year average. New listings lifted 9.4% over the month to 34,737 in the four weeks to 31 August, yet remain 10.3% lower than a year ago and 1.3% under the five‑year average, while total listings fell to 118,380 and sit 20.2% below average as absorption outpaces additions. Median days on market lengthened to 33 over the three months to August, though Perth remained brisk at 14 days while Canberra stretched to 54, reflecting varied market speeds. Auction activity ramped up late August with back‑to‑back weeks above 2,000 events, and the four‑week rolling clearance rate reached a two‑year high of 69.5% as vendors benefited from low competing stock. Earlier in August, clearance rates also firmed following the rate cut, reinforcing improving selling conditions ahead of spring according to Cotality’s weekly reads.
Rentals and Yields
Annual rental growth picked up to 4.1% nationally in August, with the combined capitals lifting to 3.4% year‑on‑year and the regions rising to 5.8% as rent momentum re‑accelerated through 2025. National gross rental yields were steady at 3.7% in August, with the capitals at 3.5% and regions at 4.4%, amid modest shifts by city compared with a year earlier.
Rates and Credit
The cash rate sits at 3.60% after three cuts, but the path for further easing looks less certain given a lift in trimmed‑mean inflation to 2.7% over the year to July and stronger‑than‑expected June‑quarter GDP at 0.6% q/q and 1.8% y/y. Borrowing costs continued to ease through July, with average variable rates on new owner‑occupier loans around 5.75% and investors at 5.94%, while shorter fixed terms have also drifted lower since January, aiding serviceability at the margin. Lenders remained cautious in Q1 data, with high loan‑to‑income and high debt‑to‑income originations edging down, even as first‑home‑buyer and investor activity ticked higher into mid‑year.
First‑Home Scheme Changes
From 1 October 2025, the expanded Home Guarantee Scheme removes income and place limits and lifts property price caps, materially widening what first‑home buyers can purchase with a 5% deposit and no lenders mortgage insurance. Cotality’s analysis indicates the share of markets under the caps will jump from about one‑third to 63.1% nationally, covering 51.6% of house markets and 93.7% of unit markets, with notable cap lifts to $1.5m across Sydney/Illawarra/Newcastle‑Lake Macquarie, $1.0m in South‑East Queensland and $900k in Adelaide. The broader settings will likely boost demand and choice for entry‑level buyers, even as underlying supply constraints and affordability limits temper price responses in the short run.
Early September Read
Through the four weeks to 9 September, combined‑capitals values rose 0.8% on a rolling 28‑day basis, with Brisbane up 1.3%, Perth 1.1%, Adelaide 0.9%, Sydney 0.7% and Melbourne 0.3%, reinforcing an active spring start with mid‑sized capitals out in front. With listings still lean versus average and clearance rates elevated, the near‑term balance of risk points to further but measured gains rather than a rapid upswing, given stretched affordability and careful lending standards.
Inflation and Interest Rates
Inflation now
The ABS reports the monthly CPI indicator rose 3.0% over the year to August, up from 2.8% in July, while the trimmed mean eased to 2.6% as underlying pressures moderated. On the quarterly CPI, headline inflation was 2.1% year‑ended to June and the trimmed mean 2.7%, the softest underlying pace since 2021 on this measure.
What’s driving prices
Housing is the main driver, with annual housing inflation at 4.5% as electricity rose 24.6% over the year to August after state rebates rolled off, even as bills fell in August when new Commonwealth relief reached NSW and the ACT. Rents rose 3.7% over the year, the slowest annual increase since November 2022, while new dwelling prices rose 0.7% amid a subdued building market. Food inflation is steady around 3.0% year‑ended, with meat and seafood at 2.9% and fruit and vegetables easing to 1.1% in August as some fresh produce prices fell.
Interest rates now
The RBA has lowered the cash rate by 75 basis points in 2025 to 3.60%, including a 25bp cut on 12 August as inflation moved inside the 2–3% target band and the outlook supported some further easing over time. In a 22 September statement to Parliament, the Governor noted underlying inflation slowed to 2.7% over the year to June and that easing aims to keep inflation near the midpoint while maintaining full employment.
September decision and implications
The RBA’s schedule confirms the Monetary Policy Board meets on 29–30 September with a decision statement and media conference on 30 September, and the minutes slated for release on 14 October, framing a clear timetable for policy communication. In testimony on 22 September, the Governor flagged a Board discussion “next week” and reiterated that policy remains data‑dependent, consistent with August forecasts that were conditioned on a market‑implied path featuring modest further easing if conditions allow.
Market watchers will track the ASX 30‑Day Interbank Cash Rate futures into the announcement, with the exchange noting the next meeting and decision timing for 30 September, providing a real‑time read on expectations.
For borrowers, the August 25bp cash‑rate cut to 3.60% has begun to flow through: major lenders such as NAB reduced variable home loan rates by 0.25% p.a., with changes effective from late August, lowering required repayments for many mortgage holders.
Risks to watch
Rebate timing is distorting electricity inflation: the ABS notes electricity rose 24.6% over the year but fell 6.3% in August as new Commonwealth energy rebates landed, masking underlying trends. Services inflation remains above goods on the quarterly CPI at 3.3% versus 1.1%, a persistence the RBA watches closely for any stickiness. The labour market has eased a little with unemployment around 4.2% in August, and the RBA highlights weak productivity and elevated unit labour costs as reasons for caution.